Exporting calculated orders data to me'scope, Applications, Xporting – Measurement Computing Medallion Rotate rev.2.3 User Manual
Page 41: Alculated, Rders, Scope, Pplications
October 2000
Medallion Rotate Manual
41
More formally, Millstrum analysis is essentially the Fourier transform of the
logarithm of the absolute value of the frequency spectrum. It identifies
periodicity in the frequency domain. The normal formulation, called the real
cepstrum, has as its abscissa the period of the harmonics, but by inverting
period, the Millstrum displays the results in the frequency domain.
Millstrum analysis uses the logarithm of the frequency spectrum to raise
the low amplitude peaks relative to higher amplitude components of the signal.
This amplifies the presence of low amplitude harmonics, such as those created
by early-stage bearing faults.
For harmonics, the peaks in the spectrum are located at multiples of the
primary frequency. The spacing (or “frequency”) between peaks is the same as
the primary frequency. So harmonics in a spectrum appear as a single peak at
the primary frequency in the Millstrum.
For sidebands, the peaks in the spectrum are located at the primary
frequency plus or minus multiples of the modulating frequency. The spacing
(“frequency”) between the peaks is the same as that of the modulating
frequency. So sidebands appear as a single peak at the modulating frequency.
E
XPORTING
C
ALCULATED
O
RDERS
D
ATA
TO
ME’
SCOPE
Medallion Rotate can export calculated order tracking data to the
ME’scope™ program (Vibrant Technology) for operating deflection shape
analysis. This allows you to see a animation of the machine as it moves in the
coherent pattern of a given order at a given speed.
There are two ways to export calculated order tracking data to ME’scope.
•
You can calculate the order tracking data in Medallion Rotate, then
export that data to ME’scope. This is limited to data from only one file.
•
You can create measurement sets from one or more data files that share
a common tachometer and reference channel. This automates the
process of calculating the order tracking data, and combines the
channels from the data files into the appropriate files for ME’scope.
A
PPLICATIONS
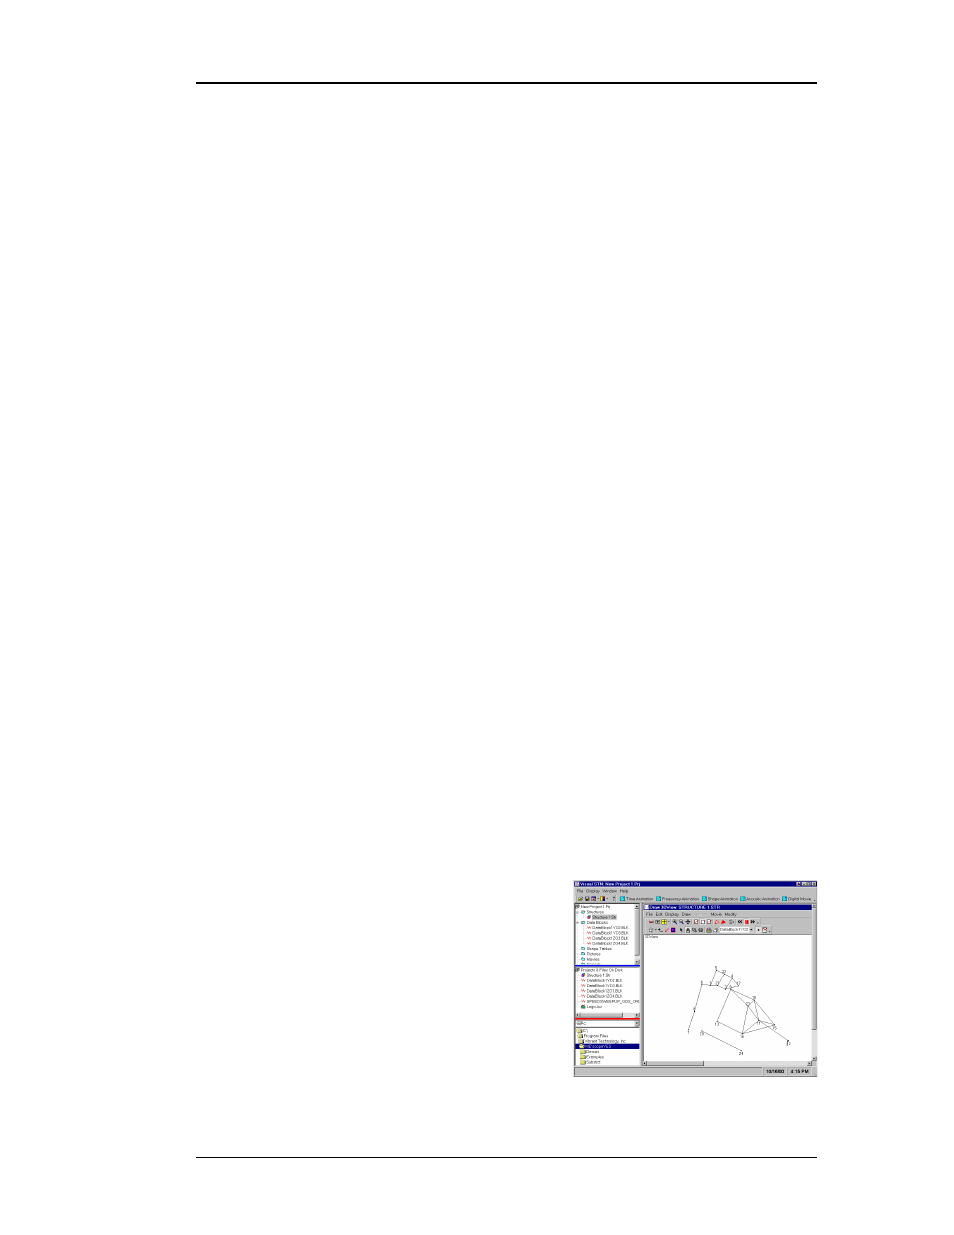
By showing you how the machine is moving, ME’scope allows you to
diagnose a variety of problems. For example, it
shows you how a drive train deflects in
response to an engine cylinder firing order. It is
also useful for diagnosing high-cycle fatigue
problems on the spring side of the engine. The
following graphic shows a wire-frame model for
data taken from a tractor engine. The data was
taken on the sub-frame and exhaust system of
the tractor during the tests.