Theory, Heory – Measurement Computing Medallion Rotate rev.2.3 User Manual
Page 28
Advertising
28
Medallion Rotate Manual
October 2000
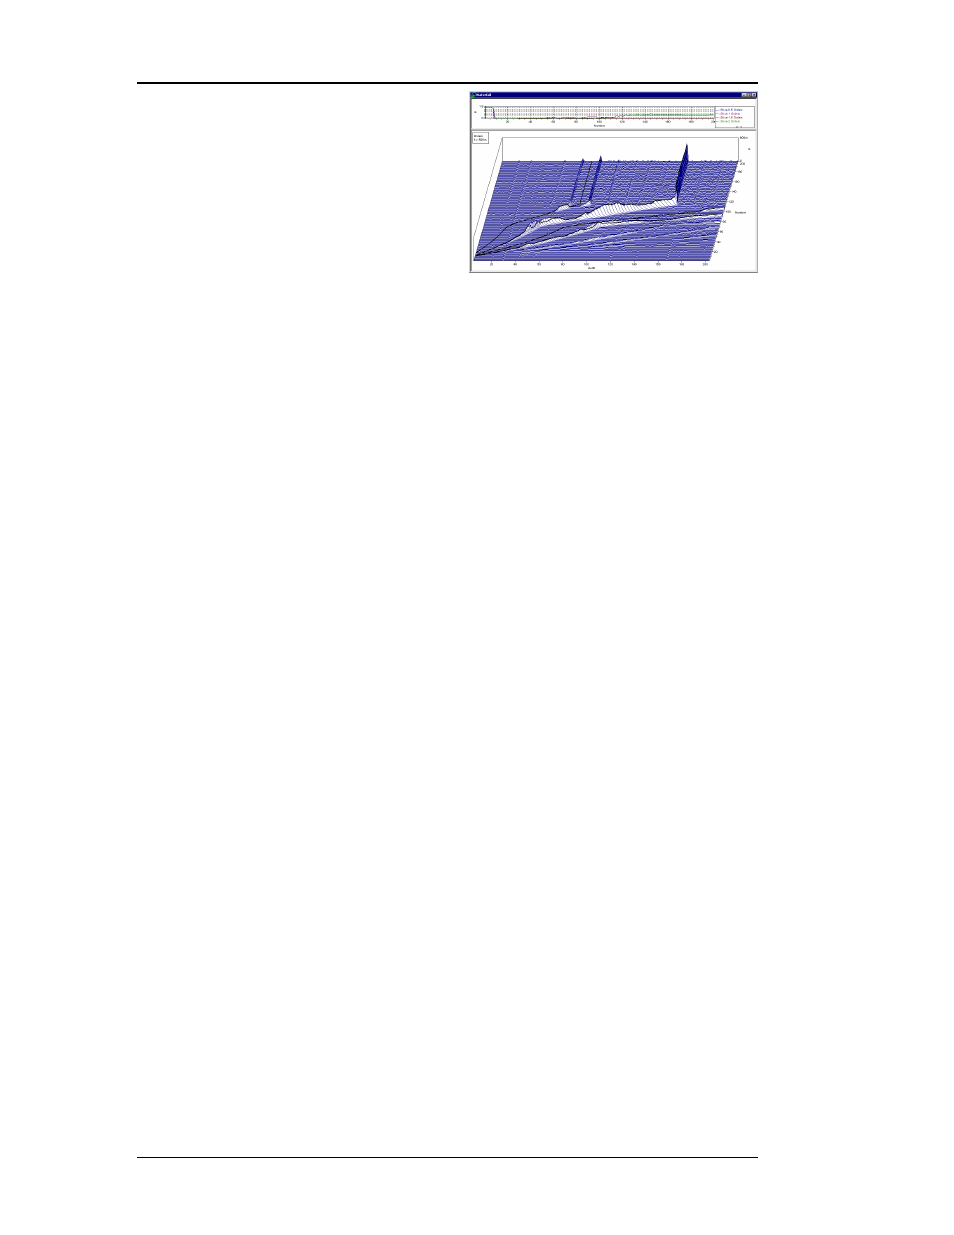
In this Waterfall plot, there are
cursors at 0.5 1, 1.5, and 2 orders. The 0.5
order cursor highlights a turbine rub that
“locks” onto one of the shaft critical
frequencies and then deviates from the 0.5
order cursor.
T
HEORY
The Medallion Rotate Waterfall
analysis uses the standard Fast Fourier transform to calculate the array of FFT
spectra and then display them in a Waterfall or Color Contour plot
(spectrogram). The spectrum calculation allows for standard parameters such as
blocksize, averaging, windowing, weighting (A, B, and C), frequency domain
integration, and integration/differentiation functions as found on most
spectrum analyzers. Medallion Rotate can display spectra as a function of
either time or RPM.
Advertising