Contour plot, Order tracking plot, Ontour – Measurement Computing Medallion Rotate rev.2.3 User Manual
Page 47: Rder, Racking
October 2000
Medallion Rotate Manual
47
C
ONTOUR
P
LOT
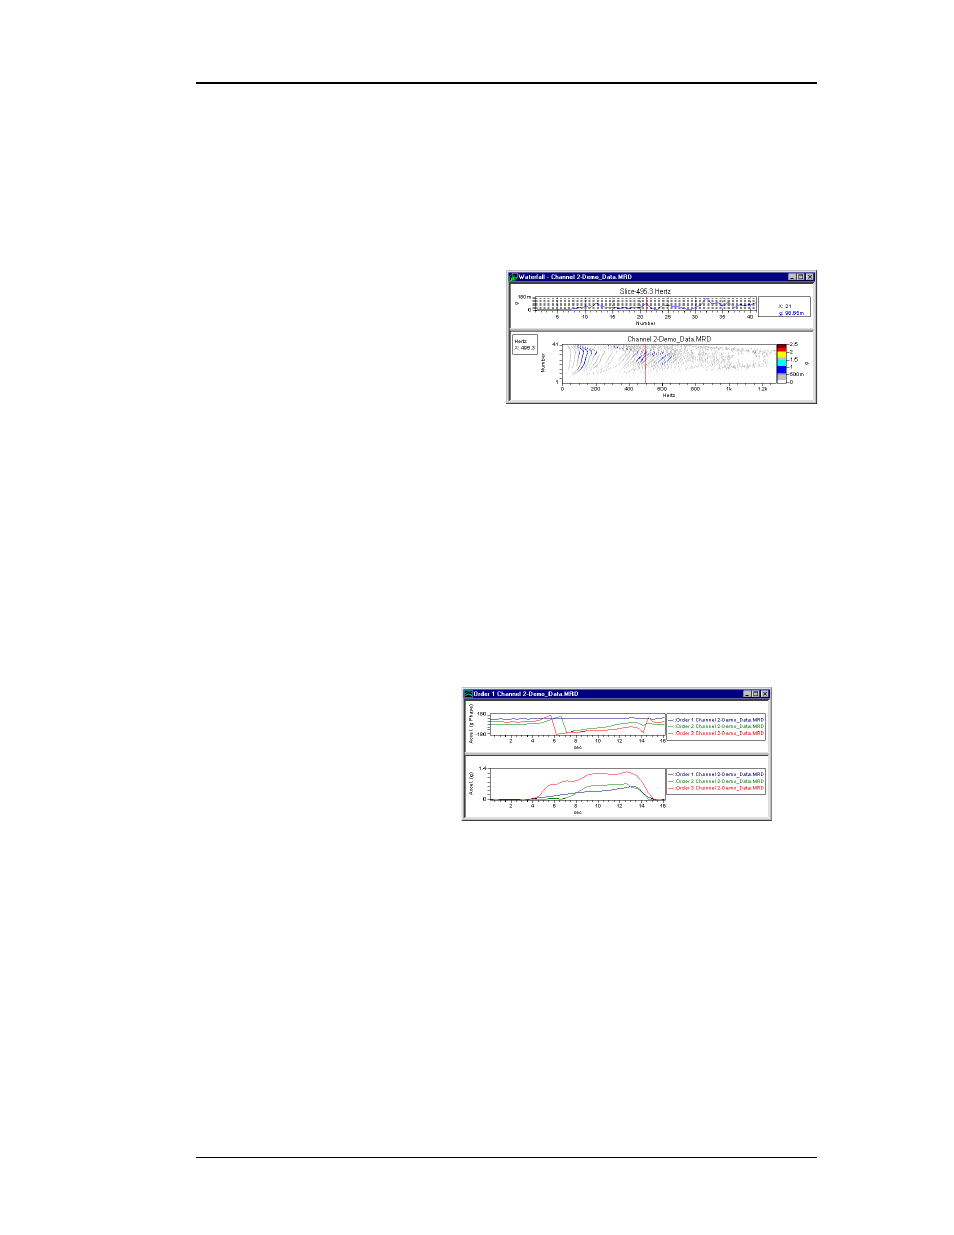
The “Contour plot is similar to a Waterfall plot in that it displays multiple
spectra plotted as a function of position. However, the Contour plot uses
contour lines or colors to identify areas of equal amplitude. While the view in a
Waterfall plot is “across” the spectra from the side, the view in a Contour plot is
from “above” the spectra, looking down on the data.
There are two ways to display a Contour plot.
• Display a Waterfall plot, then
from the View menu choose
Change Waterfall Type.
• From the Edit menu choose
Preferences. Set Default
waterfall plot type to Contour.
When you perform a Waterfall analysis or display a waterfall file,
Medallion Rotate uses a Contour plot by default.
O
RDER
T
RACKING
P
LOT
The Order Tracking plot displays the result of the Computed Order
Tracking analysis in a Bode plot format.The lower plot shows the magnitude
plotted against frequency, time, or machine speed for each order. The upper plot
shows the phase plotted against the frequency, time, or machine speed for each
order.
To display calculated Order traces, do one of the following:
• You can display a calculated Orders (orders*.tra file) curve by right-
clicking the channel in the Channel List window an choosing Plot.
• You can display multiple
order
curves together (as shown
above) by selecting the
channels in the Channel
List
window, then right-clicking
one
and choosing Plot.