Saving the plot appearance as the default, Time waveform plot, Aving – Measurement Computing Medallion Rotate rev.2.3 User Manual
Page 45: Ppearance, Efault, Aveform
October 2000
Medallion Rotate Manual
45
jumps to the nearest peak in the trace (peak mode).
• If you hold down the Shift key when moving the cursor, the cursor
moves in increments of one-tenth of the distance between data points
on the trace (fine mode).
S
AVING
THE
P
LOT
A
PPEARANCE
AS
THE
D
EFAULT
The plot Properties dialog box allows you to change the appearance of the
plot in many ways. You display the Properties dialog box by right-clicking on
the plot and choosing Properties. Once you have changed the plotÕs
appearance to your satisfaction, you can save that appearance as the default
for the plot type. Then when you open another plot of the same type, the new
plot has the new default appearance.
Use the plot Properties dialog to change the plot appearance.
From the View menu choose Save Plot Settings as Default.
T
IME
W
AVEFORM
P
LOT
A Time Waveform plot is simply a plot of the amplitude of a signal in volts
against time in seconds. You might use a Time Waveform plot for the following
purposes:
• To verify that a tachometer channel contains the correct signal.
• To make sure that a channel has good data before proceeding with
analysis.
• To determine the time or duration of a particular event for further
analysis. Some situations require recording hours of data to capture an
event that might occupy only a few minutes of data. By slicing out only
the relevant data, you can significantly shorten analysis time. See
“Export a Channel to a UFF File” for more information.
Right-click a time waveform data channel in the Channel List window and
choose Plot. You can also do one of the following:
• Select the channel and click the Plot button
.
• Double-click the channel.
• Select a channel and choose the Plot command from the Channels
menu.
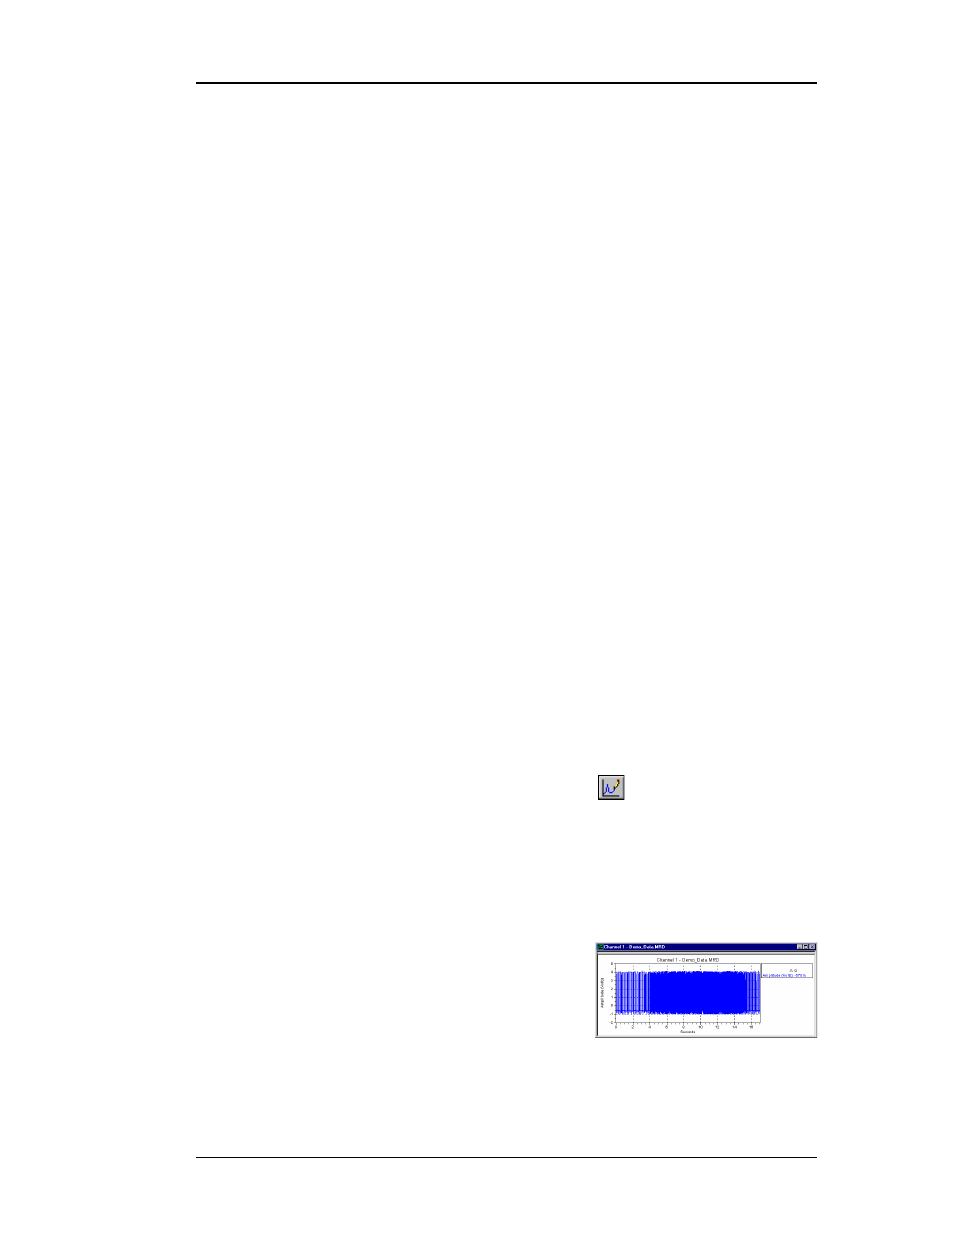
Medallion Rotate displays a plot of the time waveform.
You can overlay time waveforms by selecting two or more time waveform
channels before plotting. Note that you cannot
overlay other types of data on a Time Waveform
plot.