2 debug mode, profibus dp and slave diagnostic – Westermo FD-20 User Manual
Page 24
24
6630-2220
6.4.2.5.2 Debug mode, PROFIBUS DP and Slave diagnostic
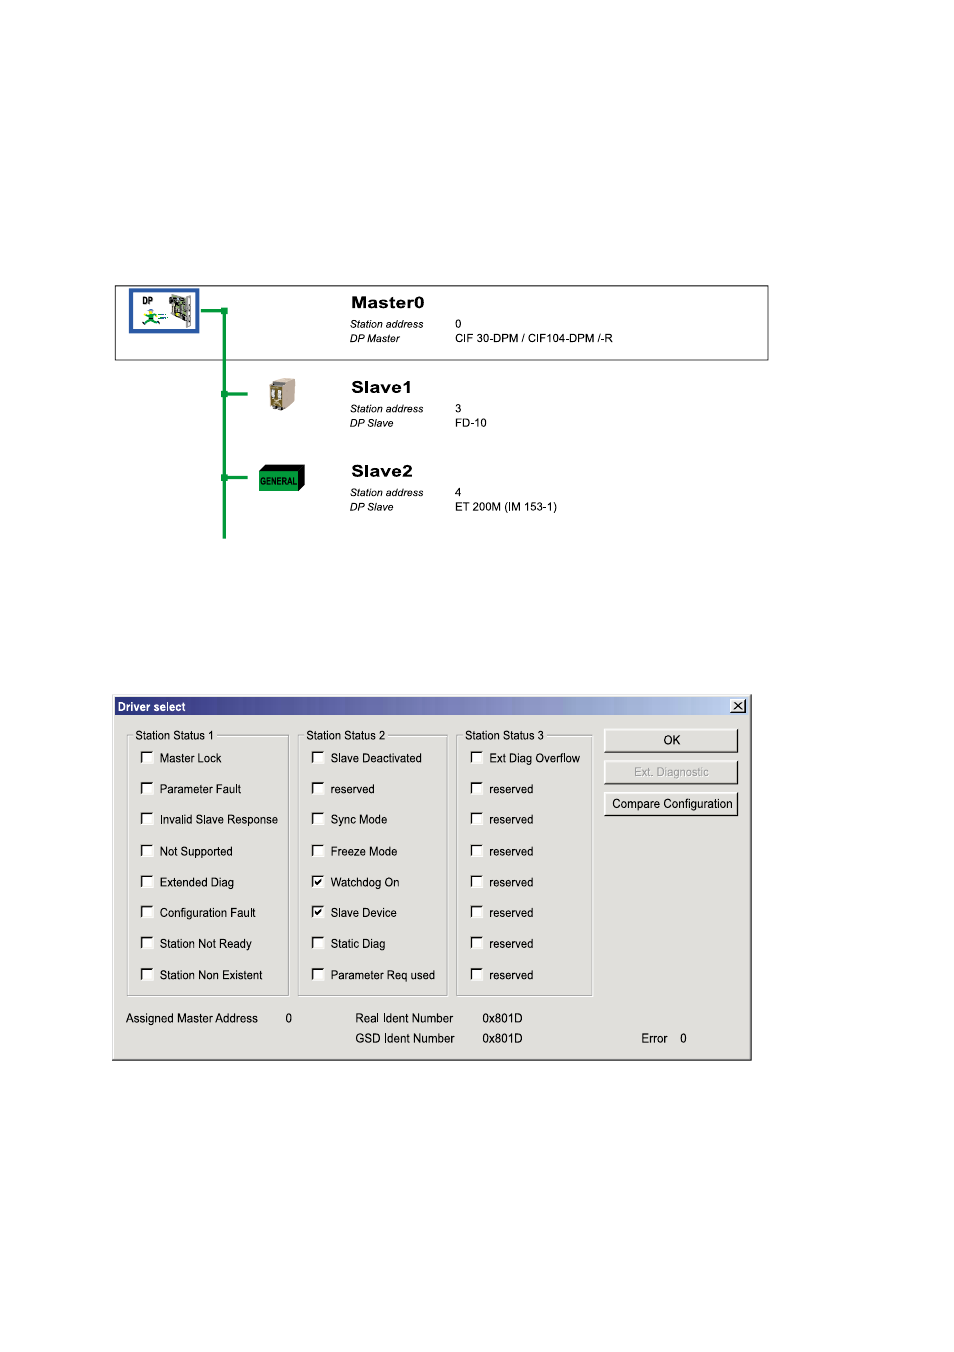
Click on the master symbol with the left mouse button.Then select the Online > Start
Debug Mode menu. After starting the debugger SyCon
®
cyclically interrogates the sta-
tus of the PROFIBUS DP network and the individual conditions of the attached devices. If
there is an error on a device the bus line to this slave is drawn in red otherwise the line
will be is green.
To end Debug Mode select the menu Online > Stop Debug Mode.
If diagnostic information is available for a specific device while running debug mode, the
text Diag appears in red next to the device icon.To get further device specific diagnostic
information then double click on the device itself or set the focus on the device and
select Online > Device Diagnostic.
To check that the I/O modules are correctly configured, click on Compare
Configuration.The SyCon
®
configuration and the actual configuration (I/O modules)
must be identical.
To get detailed information about the slave diagnostics, see Help > Help Topics..
and search for “PROFIBUS DP Device Diagnostics” under the index.
Figure 14: Debug mode
Figure 15: Slave diagnostic