Xtramus NuApps-2889-RM V1.1 User Manual
Page 51
51
E-mail: [email protected]
Website: www.Xtramus.com
XTRAMUS TECHNOLOGIES
®
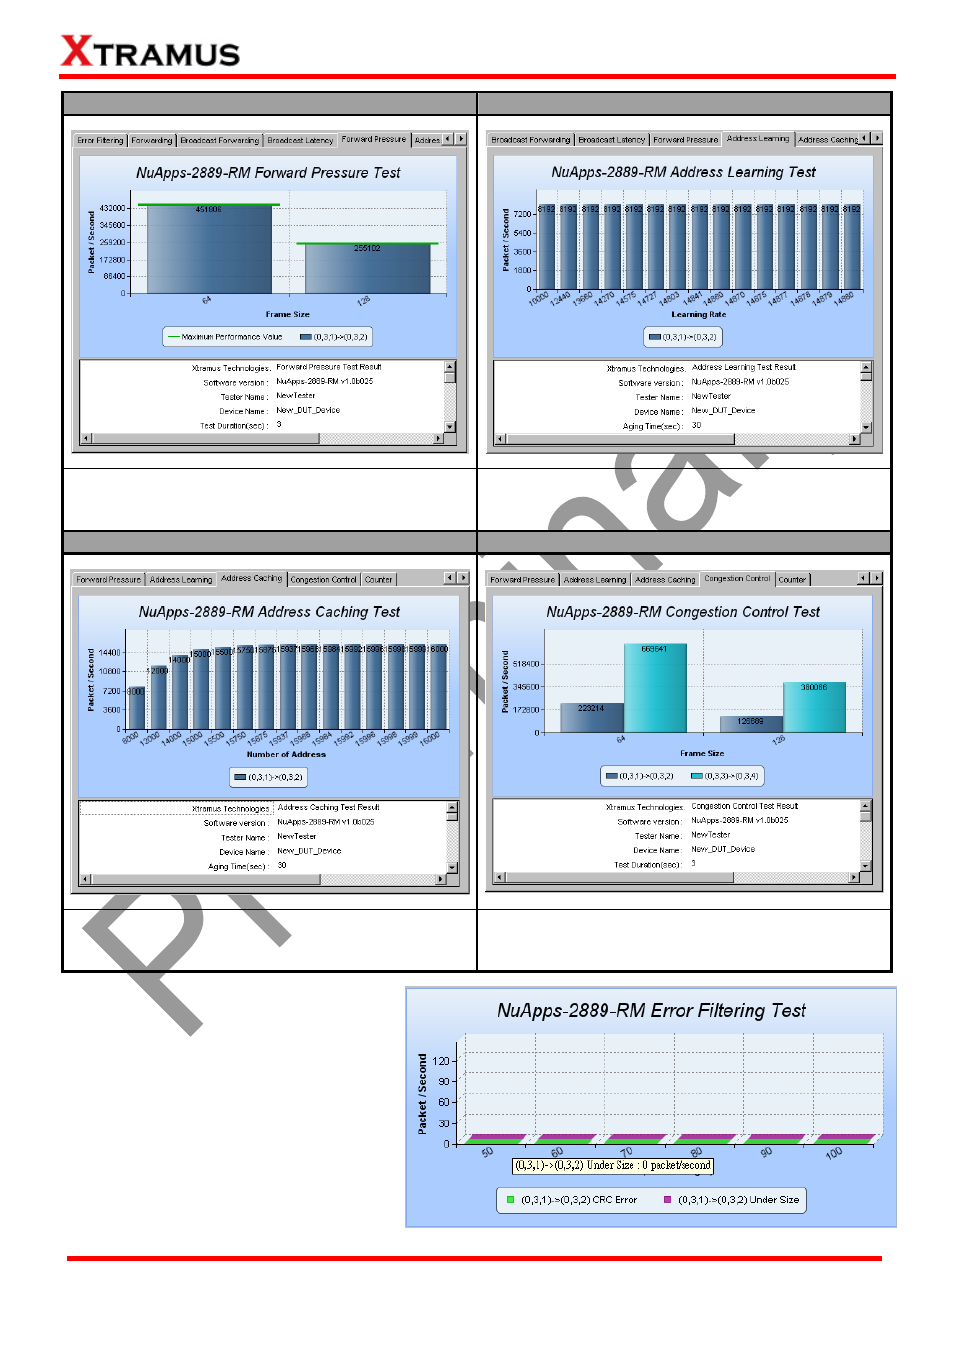
Forward Pressure Test Result Chart
Address Learning Test Result Chart
This chart uses Packet/Second as Y-Axis, and
Frame Size as X-Axis to show DUT’s Forward
Pressure performance.
This chart uses Packet/Second as Y-Axis, and
Learning Rate as X-Axis to show DUT’s Address
Learning performance.
Address Caching Test Result Chart
Congestion Control Test Result Chart
This chart uses Packet/Second as Y-Axis, and
Number of Address as X-Axis to show DUT’s
Address Caching performance.
This chart uses Packet/Second as Y-Axis, and
Frame Size as X-Axis to show DUT’s Congestion
Control test result.
To view detail statistics on the chart,
please move the mouse cursor to the
part you would like to know more, as
shown in the figure on the right.