3 colors, Colors – Xtramus NuOutlet-LN V1.1 User Manual
Page 36
36
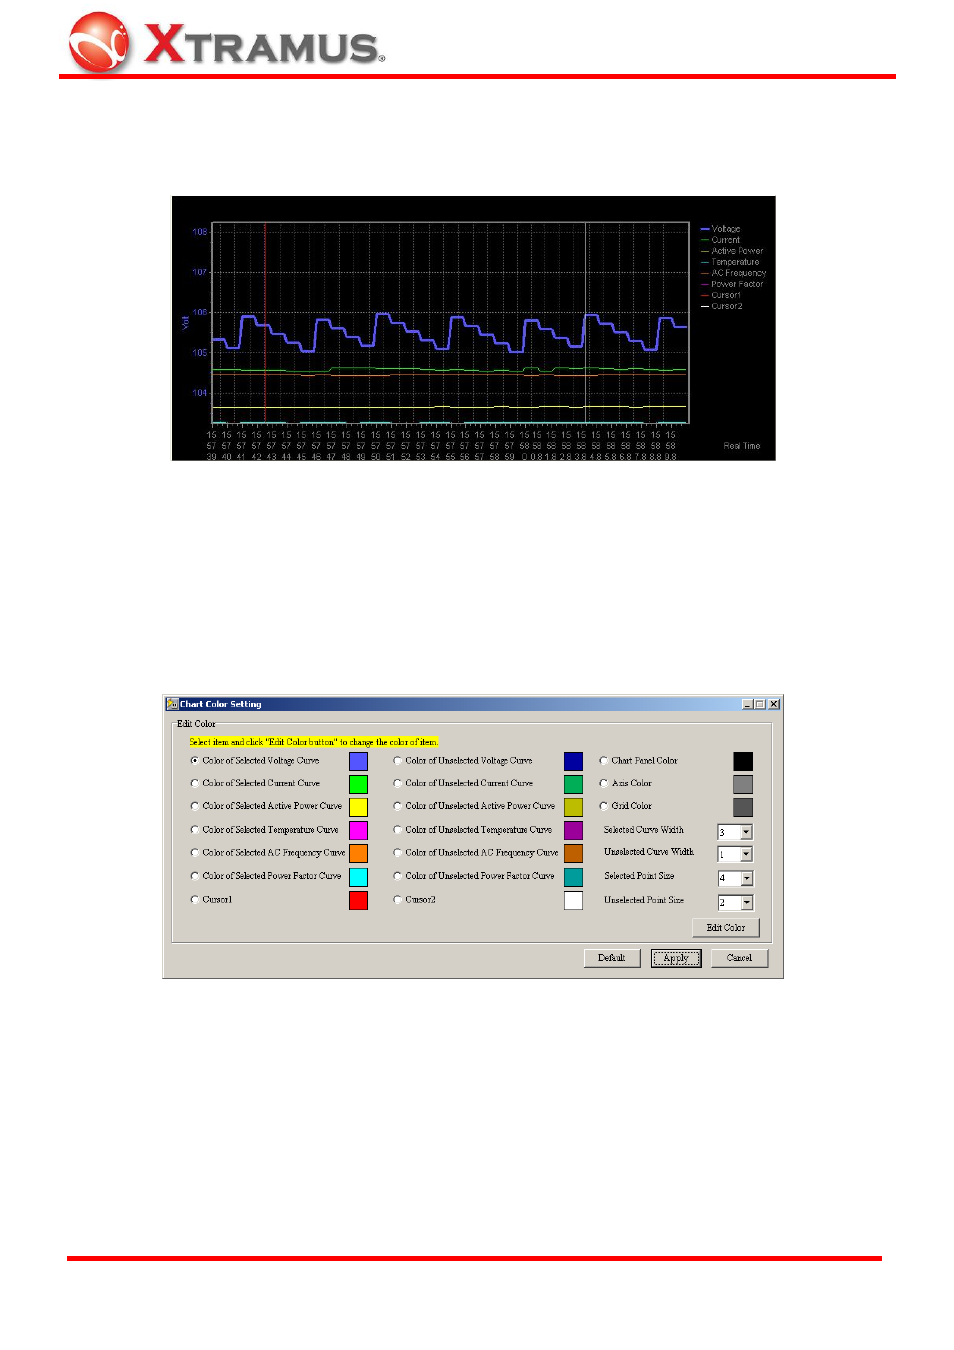
7.3.3 Colors
In the chart below, each measurement is represented by a different color for clarity.
The following selected and unselected curves can be different colors: Voltage, Current, Active
Power, Temperature, AC Frequency and Power Factor. The Chart Panel (Background), Axis, Grid
and 2 Cursors colors can also be changed. The selected and unselected curve widths can also be
chosen from the drop down lists.
1. Press
Control > Chart Color Setting to see the window below.
2. Click the radio button to select the appropriate measurement line.
3. Press
the
Edit Color button to open the color palette.
4. Press
Apply to change the chart color or press Default to return to pre-set colors. Press Cancel to
discard changes.
E-mail: [email protected]
Website: www.Xtramus.com
XTRAMUS TECHNOLOGIES
®