The toolbar – Measurement Computing USB-5100 Series User Manual
Page 62
USB-5100 Series Software Help
Preferences
The Toolbar
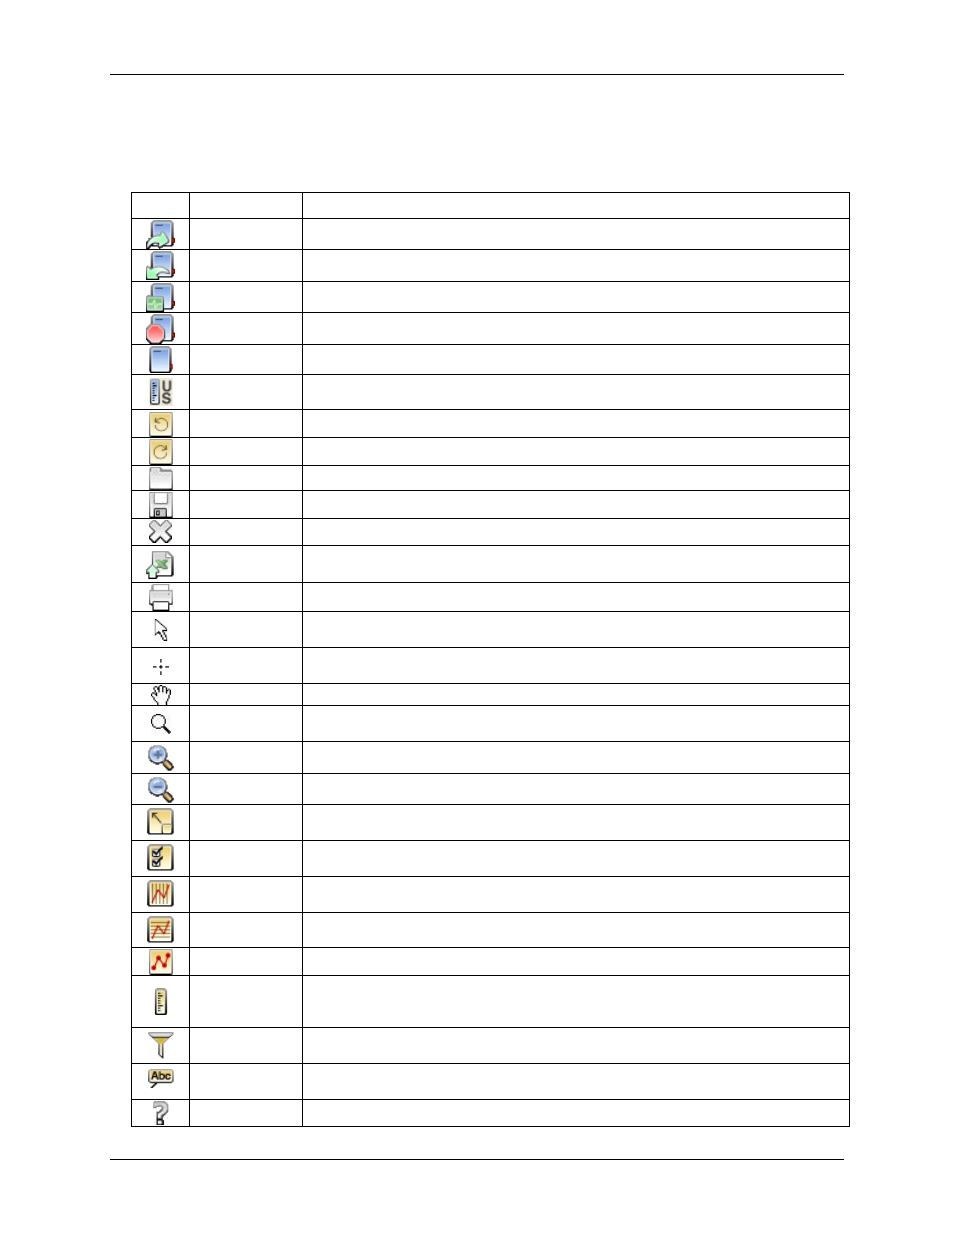
The toolbar is located at the top of the main USB-5100 Series window and allows point-and-click access to the
most frequently used functions. Pause the pointer over each icon on the toolbar for a description of each tool.
Icon
Name
Description
Opens the Launch Logger dialog box.
Opens the Readout dialog box.
Opens the Status dialog box, which displays the logger state and current readings.
Stops a logging logger.
Opens the select Device dialog box which displays available devices.
Set Default
Units
Change the default unit type between US and SI. Any changes you make does take effect with
the next plotted file
Undoes the most recent change made to the plot.
Redoes the most recent change that was undone to the plot.
Launches the Open dialog box, from which you can open USB-5100 Series files.
Save
Opens the Save dialog box, from which you can save the plot as a project (.hproj) file.
Closes the currently focused plot.
Opens the Export Options dialog box, from which you can configure settings for exporting a
text file of the data (in .csv or .txt format) for use in spreadsheet and other applications.
Prints the graph as it appears on your screen.
Launches the Arrow Tool, which you can use to point to and select items on the graph to edit
their properties.
Launches the Crosshair Tool, which you can use to display values for points on the graph and
cross-references them to cells in the Points pane.
Launches the Hand Drag Tool, which you can use to scroll an axis or the entire graph.
Launches the Zoom Tool, which you can use to adjust the scaling of an axis or the entire
graph.
Launches the Zoom In Tool, which allows you to zoom in on a smaller area of the graph.
Launches the Zoom Out Tool, which allows you to zoom out to a larger area of the graph.
Show Graph at
Full Scale
Resets the scale of a graph to accommodate all of the displayed data.
Graph
Properties
Opens the properties dialog box for the element currently selected (such as series, legend,
axis).
Vertical
Gridlines
Toggles vertical gridlines on or off.
Horizontal
Gridlines
Toggles horizontal gridlines on or off.
Mark Points
Toggles point markers on or off.
Opens the Convert Units dialog box, which allows you to convert some or all of the series on
the currently focused plot to other units (for example, from degrees Fahrenheit to degrees
Celsius).
You can create a new series based on statistical analysis of an existing series over specified
periods of time.
Opens the Graph Labels Properties dialog, which allows you to add a label to the plot or to a
specific series, and change the appearance of that label.
Help
Opens the Help.
62