Yaskawa GPD505/P5 User Manual
Page 25
21
TM.IW.01
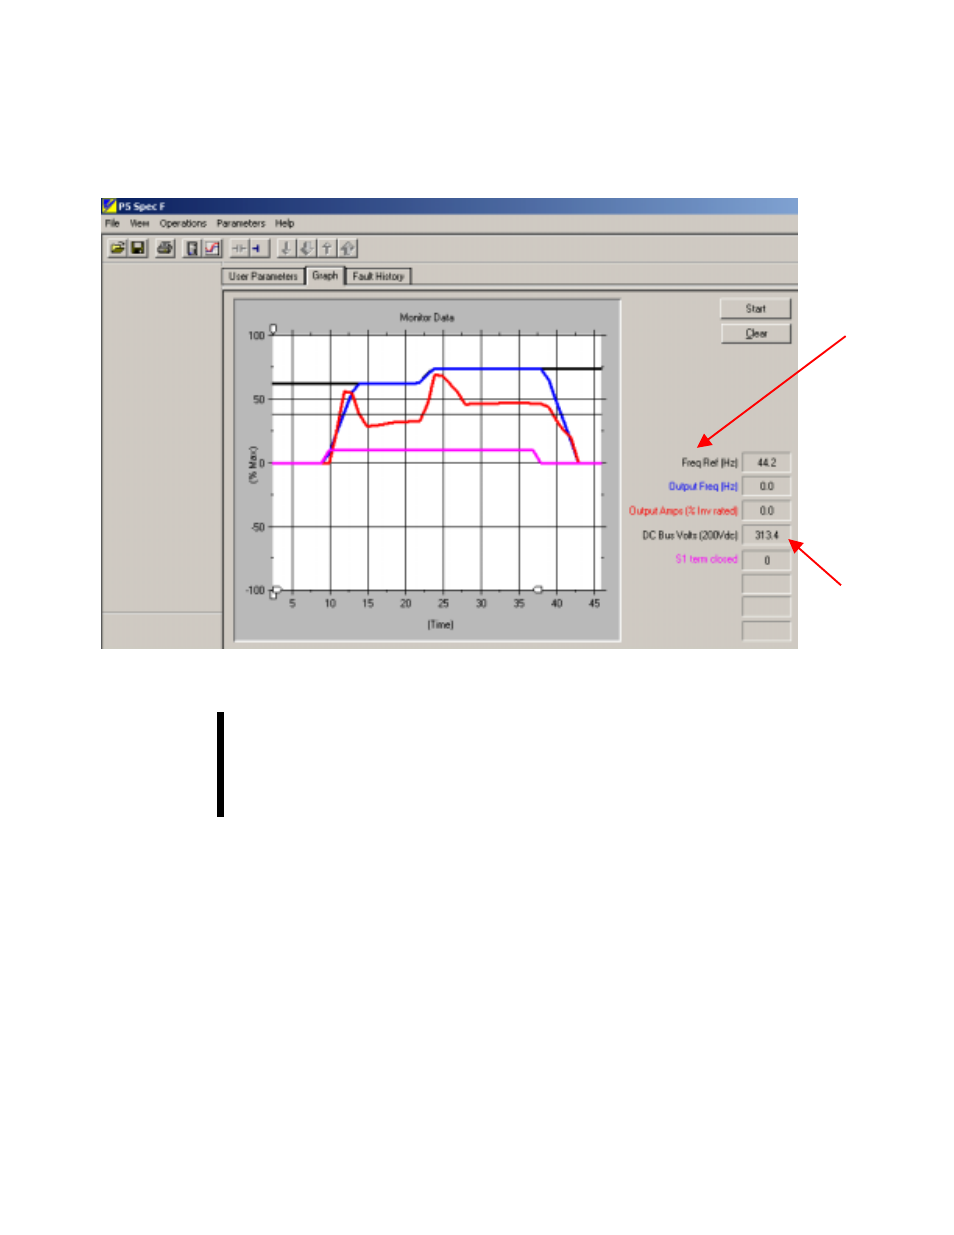
Once monitor mode is enabled and trace selection is completed, a screen similar to Figure
3.7 will appear:
Figure 3.7: Main Graph Display Window
The InverterWin
software must be in Monitor/Status mode, and the inverter
must be online, to use the graph. It must remain in Monitor/Status mode an
online, even if the inverter experiences a fault, to continue to review historical
points on the graph.
To begin graphing inverter operation click on the Start button beside the graph. The
graph will begin accumulating information and tracking from right to left. Each colored
tracking line represents one of the items to be monitored. Take care not to use the same
color for more than one item, or the graph could become confusing.
The monitor items that are being graphed appear on the right hand side of the
graphing window. The color of the text matches the graph trace color. The number to the
right of the colored text shows the current value of the monitored variable being graphed.
When the graph is stopped, the values will freeze, i.e. they are only updated while the
graph is running. The first time the graph function is used the windows will be blank until
the graph is started.
"
"
"
"
Note!
Names of
Graphed
Monitors
Current
Values of
Graphed
Monitors