Yaskawa GPD505/P5 User Manual
Page 26
22
TM.IW.01
!
!
!
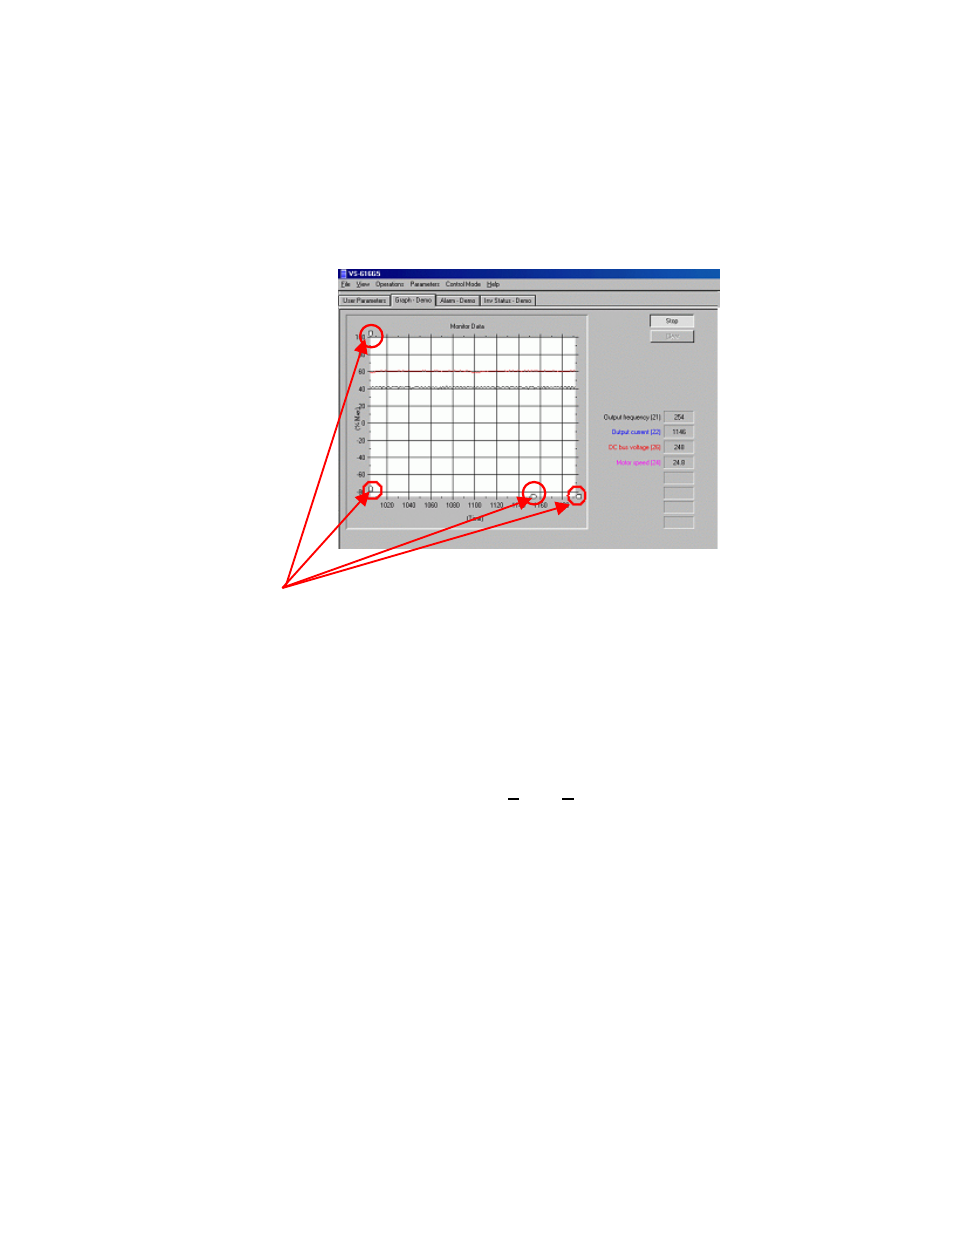
! Adjusting the Scale & Timeline
When the graph is tracking, the scale may be adjusted by “pulling” on the anchors on the
X and Y axes. See Figure 3.8 for an example.
To find a segment of the graph that has passed out of view, slide the anchors until the
necessary information is displayed. Pulling the anchors down or to the left takes the graph
back to the starting point. Pulling them up or to the right moves the scale to the present point
in time. At various points in the axes the gradients on the scale become closer together or
farther apart. The effect of these variations is to give very precise views of any point in time
on the graph. To print a portion of a graph, click on File > Print. Only the viewable portion of
the graph will be printed. Use the anchors to highlight the appropriate area of the chart, and
the proper resolution.
Figure 3.8: Changing Graph Scale
Anchors