Typical performance graphs – Linx Technologies HUM-xxx-DT User Manual
Page 5
– –
– –
4
5
HumDT
TM
Series Transceiver Specifications
Parameter
Symbol
Min.
Typ.
Max.
Units
Notes
Via POWER_DOWN
47
ms
11
Via Sleep
3
ms
11
Serial Command Response
Status, Volatile R/W
1.5
2.5
ms
8
Analog Input Reading
10
11
ms
8
NV Update, Factory
Reset
24
27
ms
8
Minimum Time between
Command Packets
100
ms
Interface Section
Input
Logic Low
V
IL
0.3*V
CC
VDC
Logic High
V
IH
0.7*V
CC
VDC
Output
Logic Low, LED_0,
LED_1
V
OLM
0.3*V
CC
VDC
1,9
Logic High, LED_0,
LED_1
V
OHM
0.7*V
CC
VDC
1,9
Logic Low
V
OL
0.3*V
CC
1,10
Logic High
V
OH
0.7*V
CC
1,10
1. Measured at 3.3V V
CC
2. Measured at 25ºC
3. MAX value represents extreme of HUM
family; HumDT value is lower
4. Input power < -60dBm
5. Characterized but not tested
6. PER = 1%
7. Into a 50-ohm load
8. From end of command to start of
response
9. 60mA source/sink
10. 6mA source/sink
11. HUM-DT in single-channel ED mode,
time to accept joining network
Figure 4: Electrical Specifications
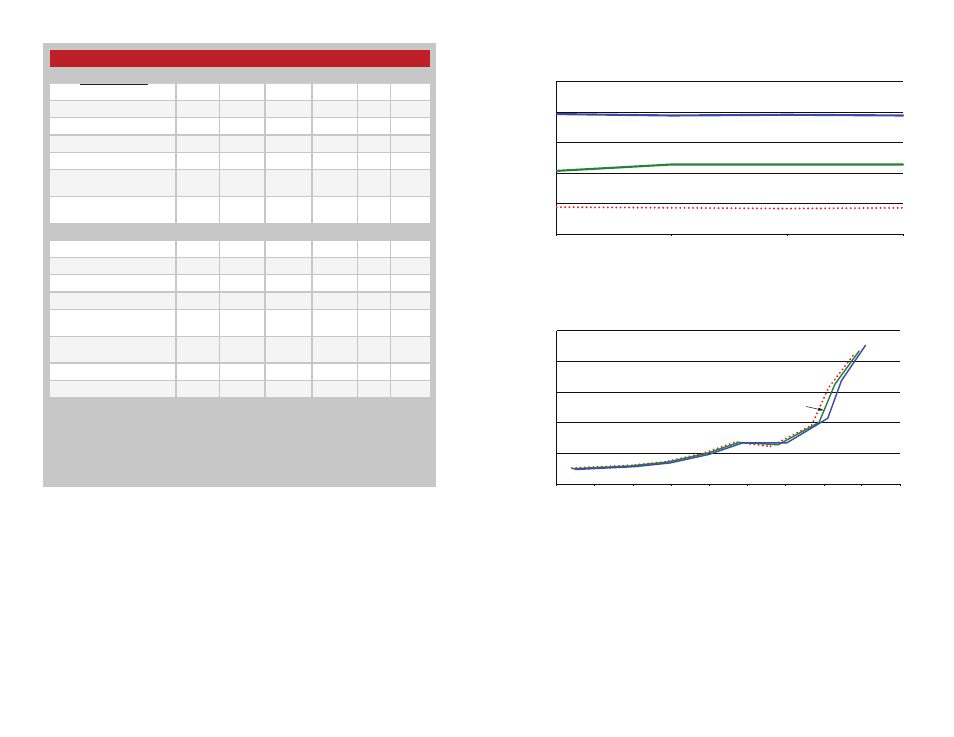
Typical Performance Graphs
Figure 5: HumDT
TM
Series Transceiver Max Output Power vs. Supply Voltage - HUM-900-DT
8.5
9.0
9.5
10.0
10.5
11.0
2.0
2.5
3.3
3.6
TX Output Power (dBm)
Supply Voltage (V)
85°C
25°C
-40°C
15.0
20.0
25.0
30.0
35.0
40.0
-30.0
-25.0
-20.0
-15.0
-10.0
-5.0
0.0
5.0
10.0
15.0
Supply Current (mA)
TX Output Power (dBm)
85°C
25°C
-40°C
Figure 6: HumDT
TM
Series Transceiver Average Current vs. Transmitter Output Power at 2.5V - HUM-900-DT