H 16.2), T sin( v v v(t) – Amprobe DM-111S Current-Data-Logger User Manual
Page 54
DMIIIS
EN - 52
16. APPENDIX 3
– THEORETICAL OUTLINES
16.1. VOLTAGE ANOMALIES (VOLTAGE SAG AND SURGE)
The instrument records as voltage anomalies all those rms values, calculated every 10ms,
beyond the percent thresholds of Voltage Reference (Vref) set during the programming
from
1% to
30 % (with steps of 1%). The maximum upper limit percent is reduced as
Vref approaches 600V. The Reference must be set to:
Nominal Voltage Phase to Neutral:
for Single Phase and 4 wires three phase system
Nominal Voltage Phase to Phase:
for 3 wires three phase system
The Instrument will detect Voltage Anomalies if the RMS Voltage Values (calculated every
10ms) beyond the above calculated thresholds. These limits remain unchanged throughout
the recording period. When a Voltage anomaly occurs the instrument records:
The number corresponding to the phase where the anomaly occurred.
The “direction” of the anomaly: “UP” and “DN” identify respectively voltage drops (sag)
and peaks (Surge).
The date and time of the beginning of the event in the form day, month, year, hour,
minutes, seconds, hundredths of second.
The duration of the event, in seconds with a resolution of 10ms.
The minimum (or maximum) value of voltage during the event.
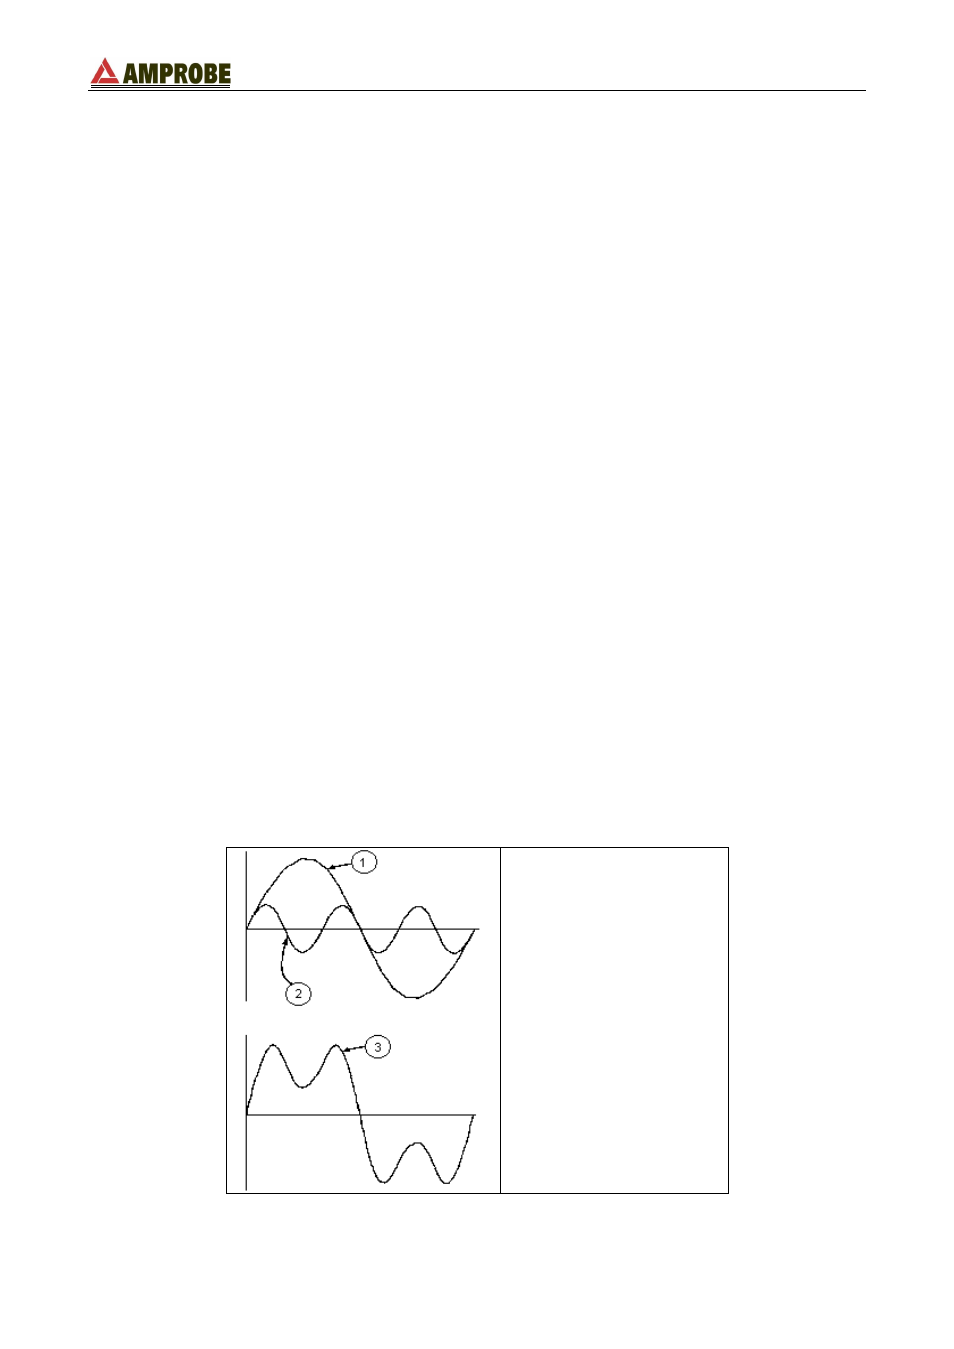
16.2. VOLTAGE AND CURRENT HARMONICS
16.2.1. Theory
Any periodical non-sine wave can be represented as a sum of sinusoidal waves having
each a frequency that corresponds to an entire multiple of the fundamental, according to
the relation:
)
t
sin(
V
V
v(t)
k
k
1
k
k
0
(1)
where:
V
0
= Average value of v(t)
V
1
= Amplitude of the fundamental of v(t)
V
k
= Amplitude of the k
th
harmonic of v(t)
LEGEND:
1. Fundamental
2. Third Harmonic
3. Distorted Waveform
Effect of the sum of 2 multiple frequencies.