History group configuration example, Network requirements, Configuration procedure – H3C Technologies H3C S7500E Series Switches User Manual
Page 142
8-8
After the above configuration, the system gathers statistics on packets received on
GigabitEthernet 2/0/1. You can view the statistics in any of the following ways:
z
View the statistics of the interface with the display command.
<Sysname> display rmon statistics GigabitEthernet 2/0/1
EtherStatsEntry 1 owned by user1-rmon is VALID.
Interface : GigabitEthernet2/0/1<ifIndex.3>
etherStatsOctets : 21657 , etherStatsPkts : 307
etherStatsBroadcastPkts : 56 , etherStatsMulticastPkts : 34
etherStatsUndersizePkts : 0 , etherStatsOversizePkts : 0
etherStatsFragments : 0 , etherStatsJabbers : 0
etherStatsCRCAlignErrors : 0 , etherStatsCollisions : 0
etherStatsDropEvents (insufficient resources): 0
Packets received according to length:
64 : 235 , 65-127 : 67 , 128-255 : 4
256-511: 1 , 512-1023: 0 , 1024-1518: 0
z
Obtain the value of the MIB node directly by executing the SNMP Get operation on the
NMS through software.
History Group Configuration Example
Network requirements
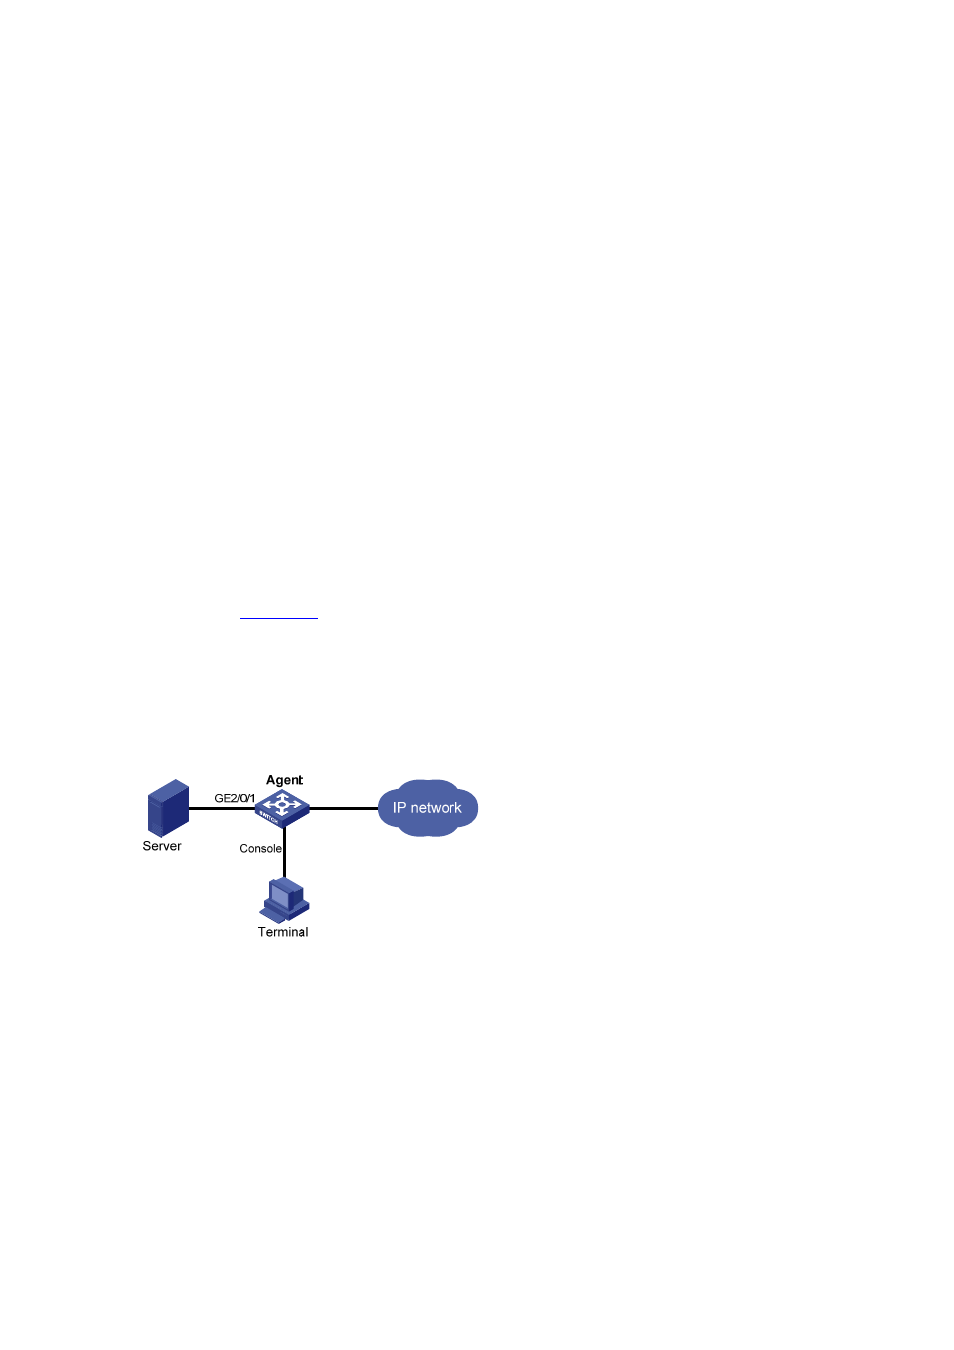
As shown in
, Agent is connected to a configuration terminal through its console port
and to Server through Ethernet cables.
Gather statistics on received packets on GigabitEthernet 2/0/1 every one minute through
RMON history statistics table, and thus the administrator can view whether data burst happens
on the interface in a short time.
Figure 8-2 Network diagram for RMON
Configuration procedure
# Configure RMON to gather statistics for interface GigabitEthernet 2/0/1 periodically.
<Sysname> system-view
[Sysname] interface GigabitEthernet 2/0/1
[Sysname-GigabitEthernet2/0/1] rmon history 1 buckets 8 interval 60 owner user1
After the above configuration, the system gathers statistics on packets received on
GigabitEthernet 2/0/1 periodically: the statistical interval is 1 minute, and statistics of the last 8
times are saved in the history statistics table. You can view the statistics in any of the following
ways:
z
View the history statistics of the interface with the display command.