Conclusion – Basler Electric BE1-87T User Manual
Page 138
Advertising
A-10
BE1-87T Setting Notes
9171300990 Rev V
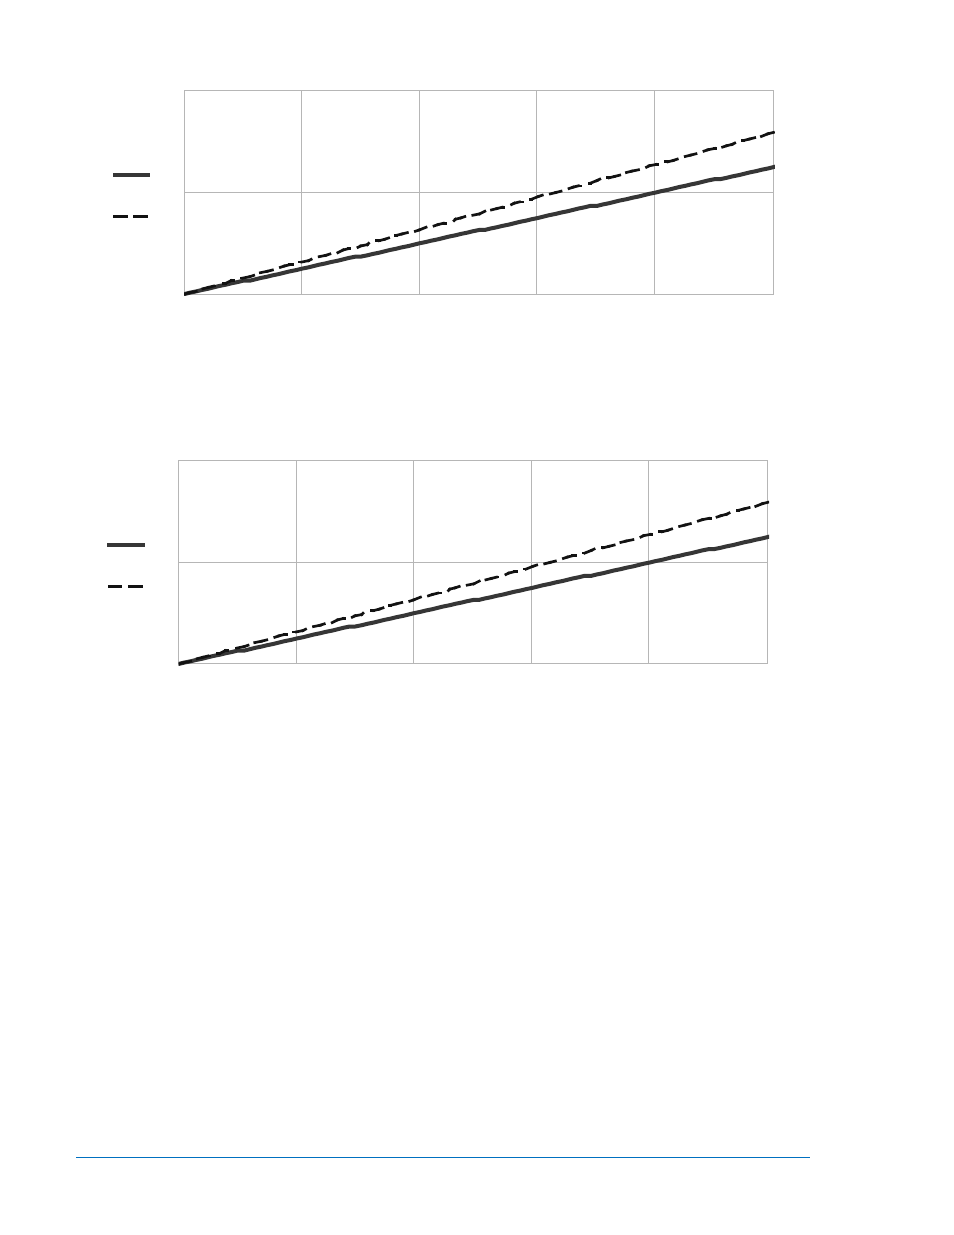
Figure A-10. Comparing SF and SF`
Figure A-11 illustrates how a lower Rs value reduces the difference between SF and SF`.
Figure A-11. Reducing the Difference between SF and SF’
Conclusion
This analysis shows that the easy to apply SF based on the ANSI Accuracy Class may yield optimistic
results in cases where the CT internal resistance is significant. The Excitation curve method, requiring
more data, yields more accurate results and should be used when the SF is marginal.
SFIF
SF'IF
IF
0
20
40
60
80
100
0
0.2
0.4
SF and SF` for Zc=2, ZB=0.5, Rs=0.2
SFIF
SF'IF
IF
0
20
40
60
80
100
0
0.2
0.4
SF and SF` for Zc=2, ZB=0.5, Rs=0.2
Advertising