Figure 69 – H3C Technologies H3C SecCenter UTM Manager User Manual
Page 84
76
•
Click the icon to export reports.
describes the service distribution query options on the service traffic distribution report page for
a single user.
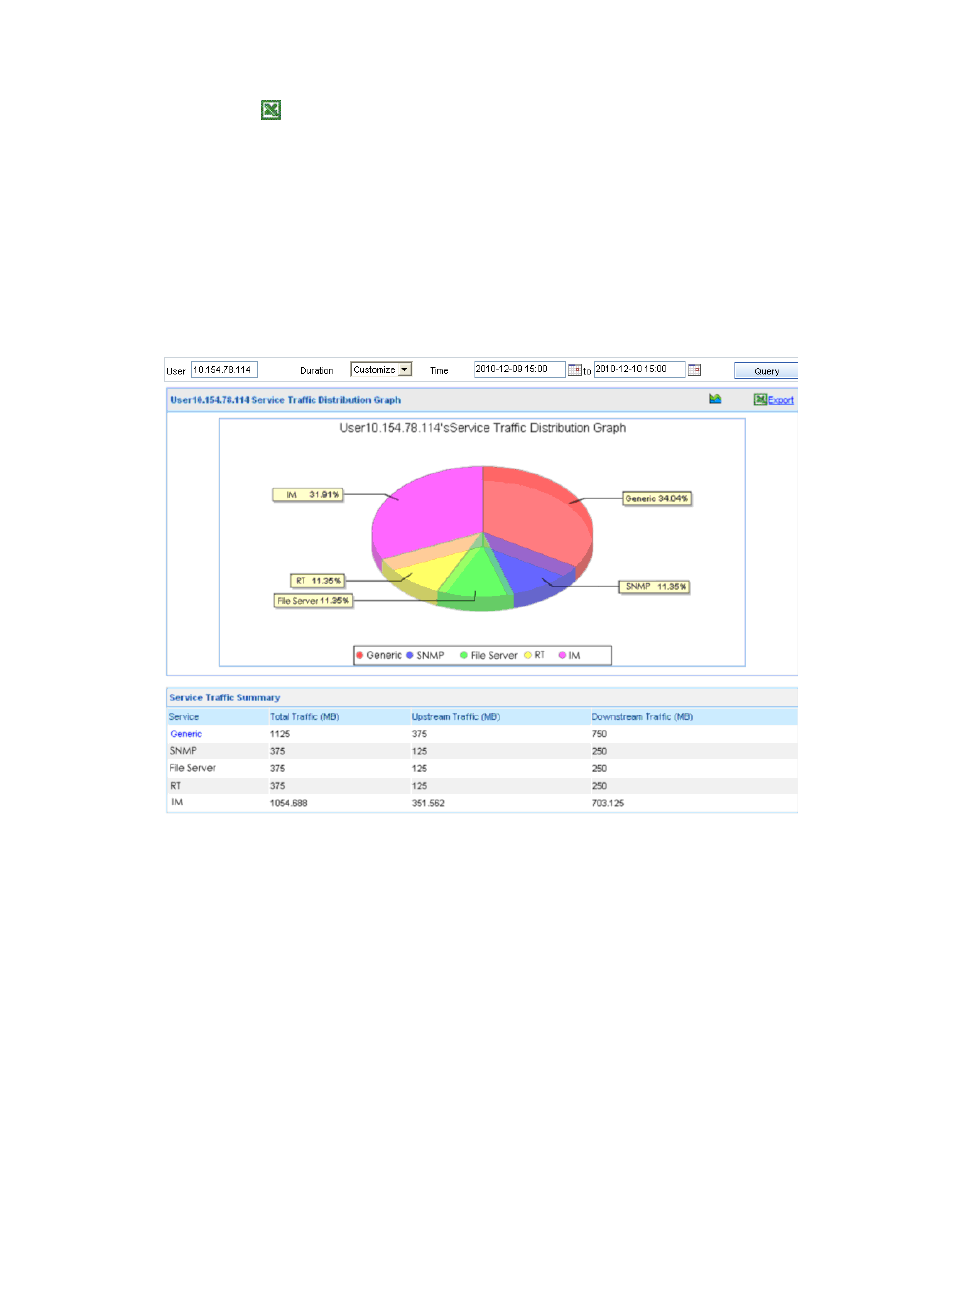
Level-1 service traffic distribution of a single user
The report page of the level-1 service traffic distribution for a single user is divided into two areas:
•
The upper area displays the traffic distribution of service types in a pie chart.
•
The low area lists the service traffic summary, and you can click a service type link to enter the
report page of the level-2 service traffic distribution.
Figure 69 Level-1 service traffic distribution of a single user
Level-2 service traffic distribution of a single user
Similarly, the report page of the level-2 service traffic distribution for a single user is divided into two
areas:
•
The upper area displays the traffic distribution of services of the same type in a pie chart.
•
The lower area lists the service traffic summary.