Insecurity category statistic report parameters, Insecurity category statistic pie chart, Insecurity category statistics – H3C Technologies H3C Intelligent Management Center User Manual
Page 270
254
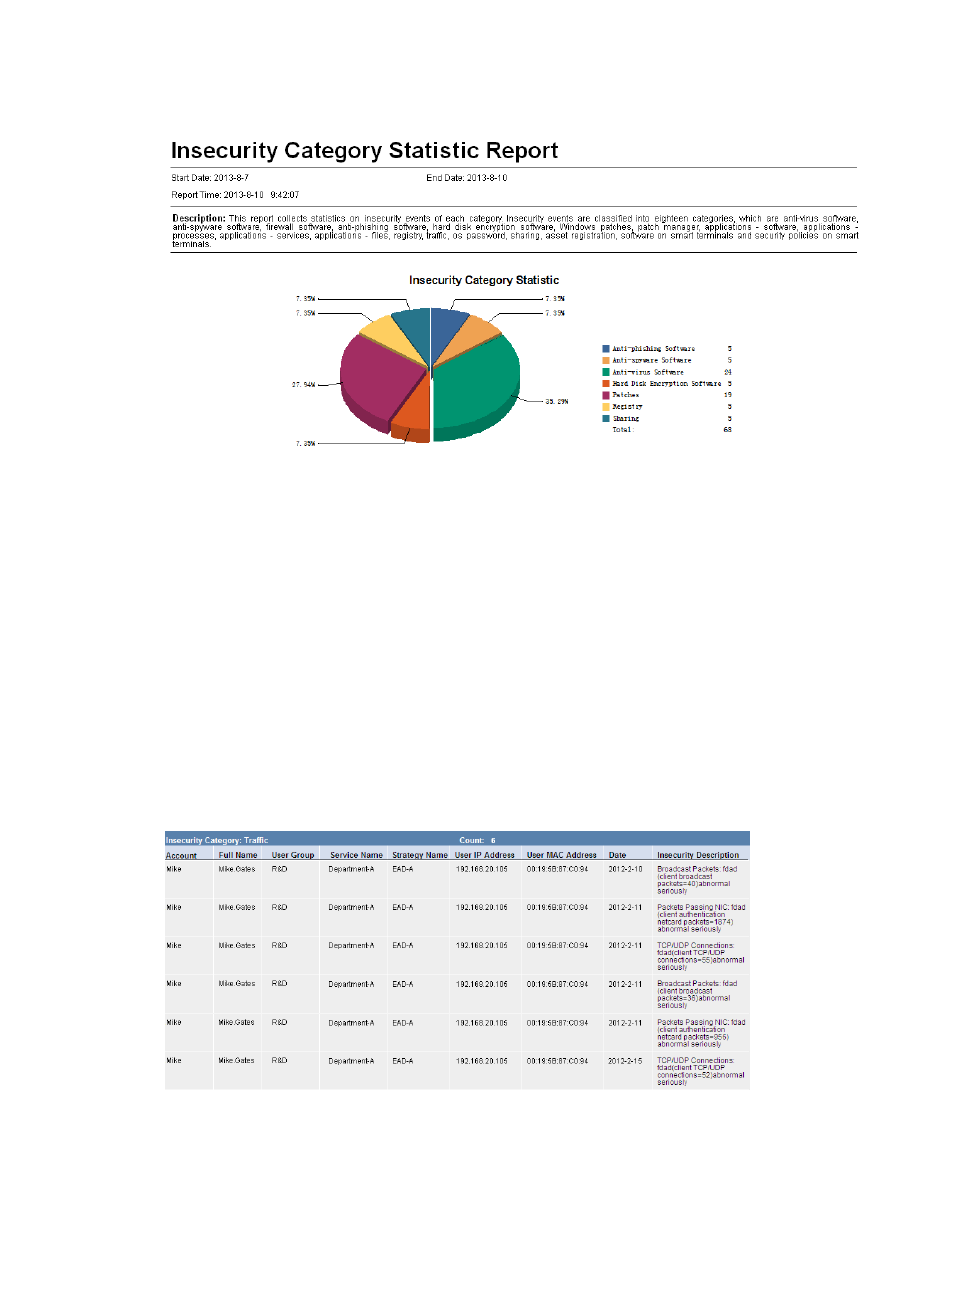
Figure 33 Insecurity category statistic report
Insecurity category statistic report parameters
•
Start Time—Start time for the report statistics.
•
End Time—End time for the report statistics.
•
Report Time—Time when the report was generated.
•
Description—A brief description of the report.
Insecurity category statistic pie chart
The insecurity category statistic pie chart displays the percentage of security check failures of each
insecurity category to the total security check failures. Click a slice in the pie chart to see statistics about
the specified insecurity category.
Insecurity category statistics
shows statistics for an insecurity category.
Figure 34 Insecurity category statistics
•
Insecurity Category—Insecurity category whose statistics are collected.
•
Count—Number of insecurity check failures belonging to the insecurity category.
•
Account—Account name of the access user.