Safe log gather statistic pie chart, Insecurity category statistics – H3C Technologies H3C Intelligent Management Center User Manual
Page 285
269
•
End Time—End time for the report statistics.
•
Report Time—Time when the report was generated.
•
Grade Node—Name of the node whose statistics are collected by the report. All indicates all nodes.
The report collects statistics about only nodes to which the current operator has privileges.
•
Description—A brief description of the report.
Safe log gather statistic pie chart
The pie chart displays the distribution of insecurity events on a node and all of its child nodes. The
insecurity events are:
•
Anti-virus software
•
Anti-spyware software
•
Firewall software
•
Anti-phishing software
•
Hard disk encryption software
•
Windows patches
•
Patch manager
•
Applications - software
•
Applications - processes
•
Applications - services
•
Applications - files
•
Registry
•
Traffic
•
OS password
•
Sharing
•
Asset registration
Click a slice in the pie chart to see statistics for the specified insecurity category.
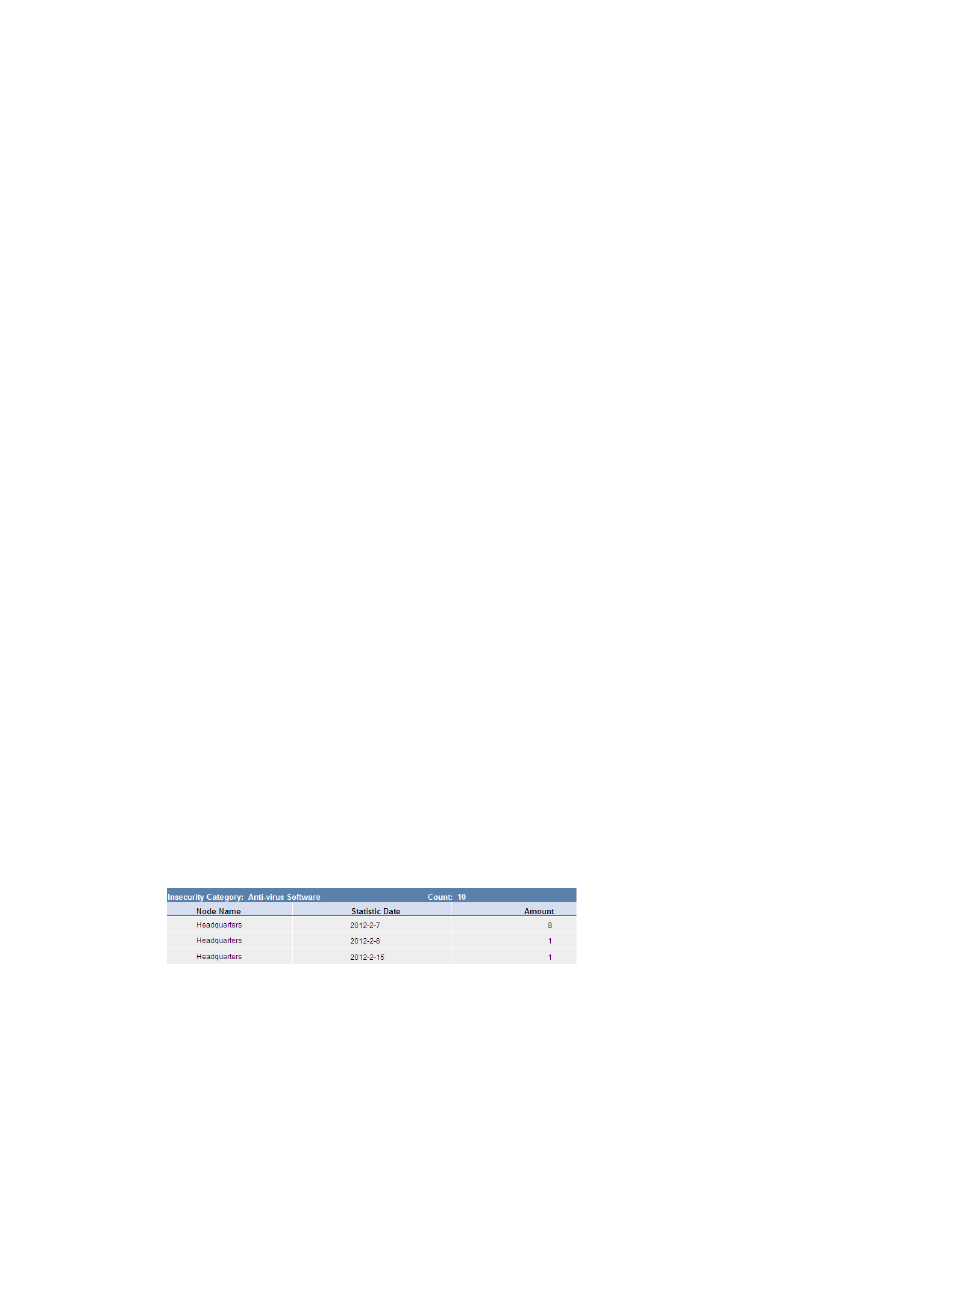
Insecurity category statistics
shows statistics for an insecurity category.
Figure 48 Insecurity category statistics
•
Insecurity Category—Insecurity category whose statistics are collected.
•
Count—Number of insecurity events belonging to the insecurity category.
•
Node Name—Name of the current node or child node.
•
Statistics Date—Date when the statistics were collected.
•
Amount—Number of insecurity events.