Amprobe A-5000 Sheath Fault Locator User Manual
Page 13
11
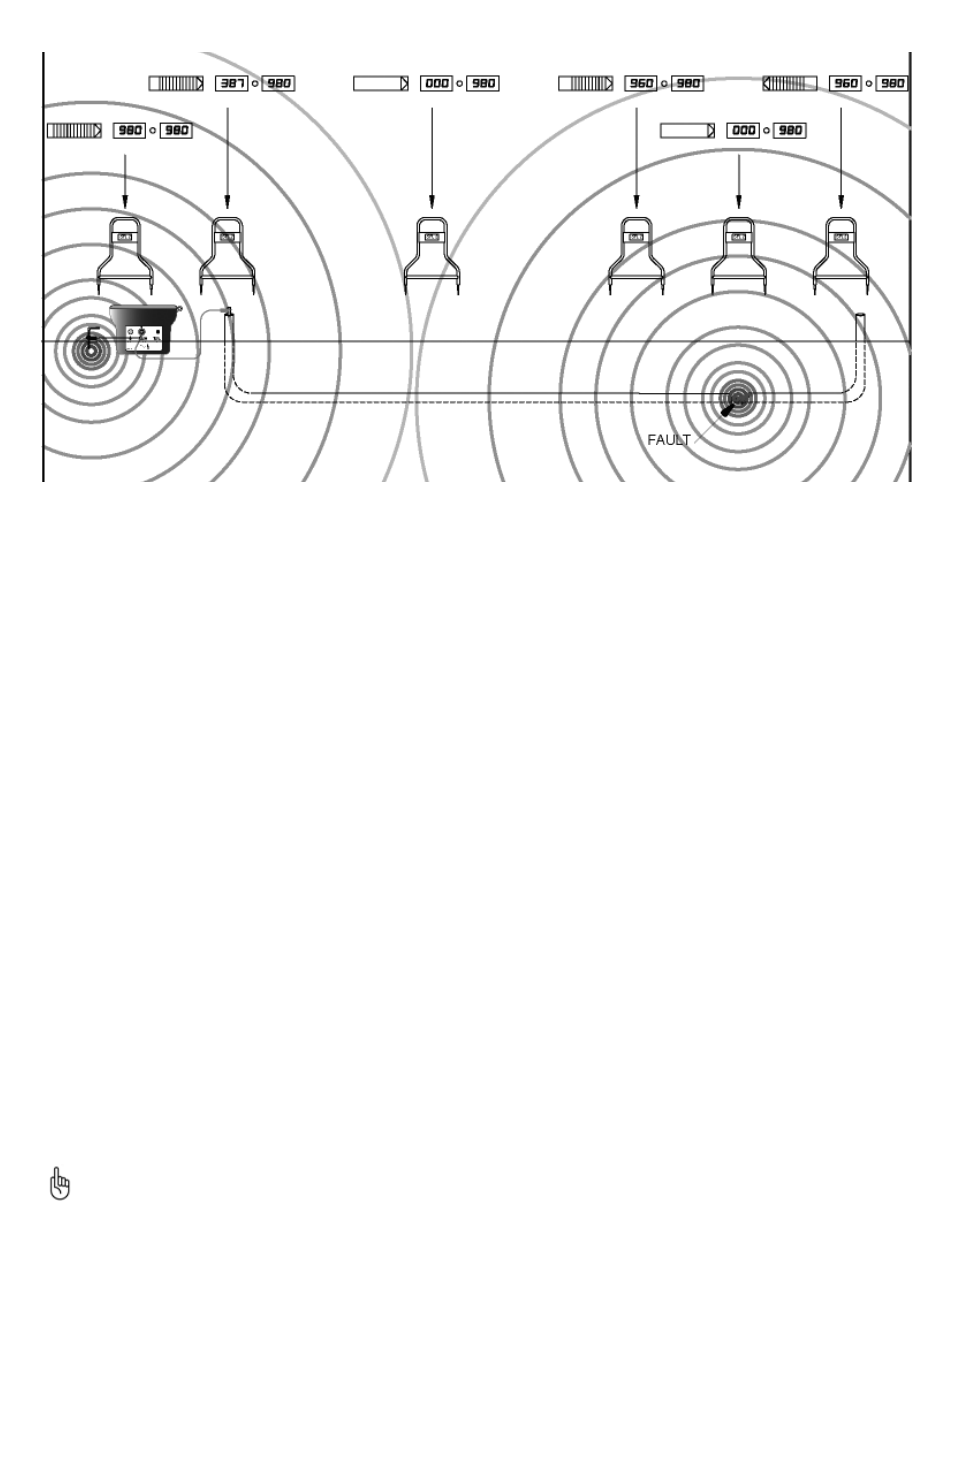
Figure 5-2: Signal Pattern Around Fault and Ground Point
The A-Frame Receiver compares the readings taken by the two probes and determines the direction and size of the fault.
Directional blinking arrows guide the operator to the exact source of the fault. The A-5000 bar graph and numerical active LCD
display indicates the relative distance to the fault and it is size.
Earth voltage Gradient
Note in Figure 5-2 that the gradient pattern appears to be concentric circles near the fault. Properly interpreting this pattern is
the key to successful operation of the A-5000.
Equipotentials
The circles shown in Figure 5-2 represent lines of equal voltage. The boxes show what the bar graph will display with the A-5000
in different positions. Thus, if the A-5000 A-Frame were inserted so that both of the ground spikes were on the same circle,
there would be no difference in voltage between them. The bar graph will show zero, the arrows will become erratic and the
numerical active display will show a zero. One of these positions occurs when the fault is directly between the spikes.
This result can also occur midway between the ground spike and a fault and when the A-5000 is exactly perpendicular to the
fault. There is a return field around the transmitter ground spike. As you move toward the fault, the bars and the active
numerical number will decrease until you reach the midpoint between the fault and ground spikes. At the half waypoint
between the fault and ground spike, the signal strength is at it is absolute lowest. At this point the bar graph and active display
will show zero and the arrows become erratic.
To determine if you are midway between faults or directly over a fault, move the A-5000 further from the transmitter and
measure again. If the arrows tell you to continue in this direction, the zero point was a midpoint. If the arrows tell you to return
toward the transmitter, the zero point was a fault. As you continue, they will increase until you reach the fault.
Nearly 70% of the signal exists within the last 1/3 of the distance between the ground spike and the fault. The amount of signal
measured and displayed by the A-5000 is proportional to the number of field lines in Figure 5-2 between the A-5000 A-Frame
spikes. Thus, the maximum signal point occurs when one A-Frame spike is directly above the fault.
By probing around the ground point, a user can learn what to expect at the fault from the A-Frame bar graph response. As
shown in Figure 5-2, the signal pattern around the fault and ground point is identical (if there are no nearby conductors). This
means that the A-Frame will react the same way around the fault as at the ground point.
As you move toward the fault, the bars and the active numerical display will decrease until you reach the midpoint between the
fault and ground spike. As you continue, they will increase until you reach the fault.
Multiple Fault Patterns
The signal pattern created by two faults in a line is depicted in Figure 5-3. The two faults are shown without the ground point.
Notice that from a distance the two faults will have the appearance of a single fault due to the equipotential circle around
them both. As you get closer, the individual faults become apparent. There is an area between two faults where the A-Frame
may give a false indication of another fault. This is caused by the two faults canceling each other. Errors can be avoided in this
situation by following the procedure described in Section 7.7.
We recommend that multiple faults be attacked one at a time. Whenever a fault is positively located, it should be repaired
before looking for the other faults.