Understanding the bar graphs and indicators – Omnia Audio Omnia F/XE User Manual
Page 39
OmniA F/XE PrESEt EditOr |
37
Understanding The Bar graphs and Indicators
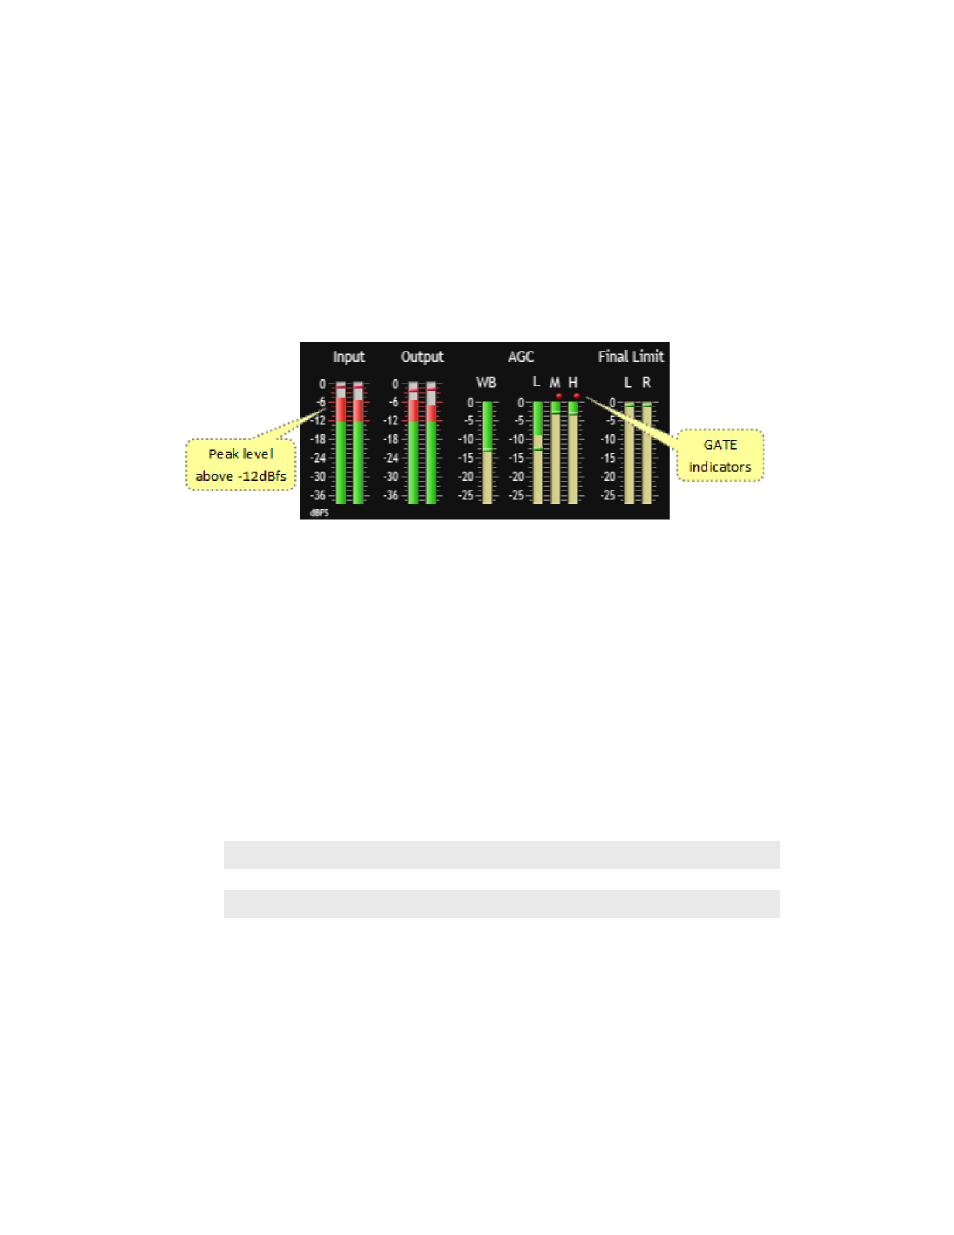
The bar graphs indicate more than just level information. The texture and density of the audio signal can be
observed, based upon the dynamic action of the bar graphs, and peak-responding “pills”. The “pills” at the
end of the input and output meters indicate peak level. The bar section represents the RMS average of the
signal. Wide dynamic range will display a separation between the pills and the bar, whereas signal with little
peak information will cause the pills to ride on the crest of the bar graph. The bar graphs can indicate up to
25 dB of gain reduction.
The bar graphs provide a wealth of information about the processing control in Omnia F/XE. The
algorithms automatically adapt the style of compression/limiting control being employed on a moment-
by-moment basis. This can be deduced if the metering is studied over time. During normal operation, the
indicators will have a dynamic “bounce.” Every now and then, the processor will react quickly and show a
larger amount of gain reduction. The meter response is very fast, but the action will recover very slowly, and
return to “rest” with the main bar graph. This action will be easily noticed on material that is very dynamic
in texture.
Another feature unique to Omnia F/XE is processor “Hold”. During brief pauses in audio, the bar graphs
will “freeze” and the GATE indicators will show the processor has entered the Hold mode of the algorithm.
This is most easily noticed when there is a “dry” voice being processed.
The Input/Output level meters will change from green to red whenever the level exceeds –12dBfs. The pills
will also change color on the Input/Output displays. The dynamic processing section the pills maintain the
same color.
Note:
The input and output levels are displayed relative to 0dB full scale (0dBfs). The 0 indicator
on the input/output bar graphs represents every available bit of signal level is being used.
Additional level at this point will create distortion.