Interpreting the gain reduction meter displays – Omnia Audio Omnia F/XE User Manual
Page 40
38
| Section 5
Interpreting the Gain Reduction Meter Displays
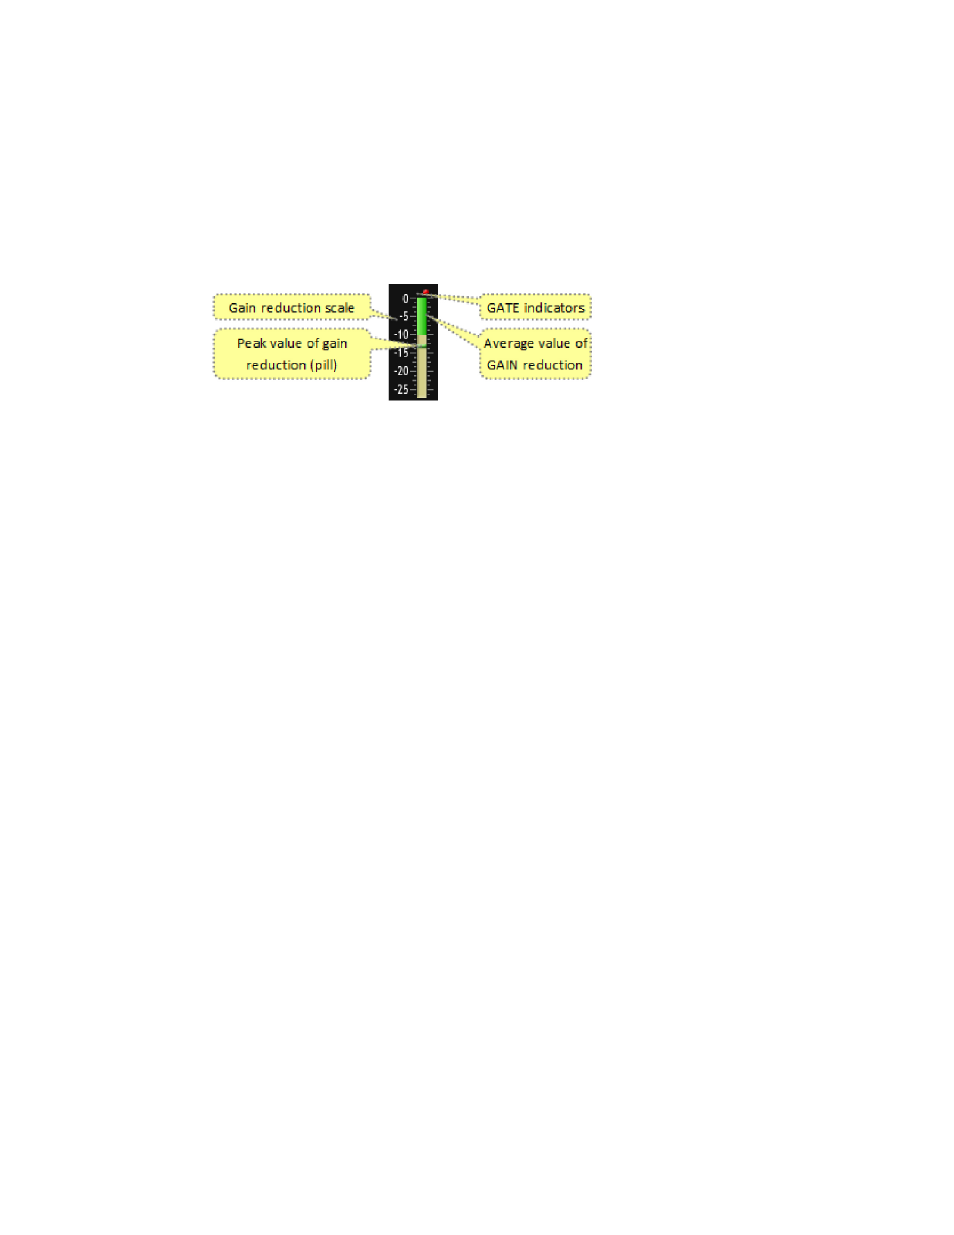
Through careful observation of the processing bar graphs, significant information can be acquired and
analyzed about the audio signal on a moment-by-moment basis. The bar shows the average value of the gain
reduction, while the floating pill indicates the peak value of gain reduction.
Since the processing algorithms in Omnia F/XE ‘adapt’ to the audio, the processor is capable of performing
many different processing functions at different times. The processing display bar graphs may appear to
indicate different kinds of operation with different program material. This behavior is primarily based on
dynamic range differences in the applied program material. For program material that is already processed
or lacking dynamic range, the bar graphs will indicate differently than with material that possesses a high
degree of dynamic range. This is because audio signals that lack dynamic range, whether naturally or by pre-
vious processing, will possess a lower peak to average ratio. Conversely, audio signals with a wide dynamic
range possess a higher peak to average ratio. The Omnia F/XE adapts differently to each case.
For program material that has low dynamic range (or high RMS and low peak levels), there will be more
activity in the WB-AGC sections and less activity in the Multiband Processors. This behavior is due to
the WB-AGC response to high RMS energy, while the Multiband section is reacting to lower peak energy.
Sometimes the Multiband section may not indicate any action at all. For Omnia F/XE, this is normal
behavior. Examples of this behavior might be seen with heavily processed commercials or music, or with
music passages of sustained level. A good example is the Aerosmith CD “Pump.” This recording has very
little dynamic range. Try any up-tempo selection from this disk and you will see the Wideband-AGC section
make initial adjustments along with small amounts of limiting. Once adjusted, the Wideband-AGC section
will stay deep in gain reduction, although with little movement, and action within the limiters will be
minimal.
When the programming has wide dynamic range (low RMS and high peak levels), the opposite will occur.
The Multiband section becomes active, while the WB-AGC section will appear not to respond as much. Dur-
ing these events, the Multiband sections could be working aggressively, while the WB-AGC section indicates
little activity. Good examples of programming able to cause this behavior are vocal passages, live voice,
classical music, or passages with high transient levels. Good test examples are almost anything classical, as
well as almost anything by Steely Dan.
The WB-AGC section is designed to operate much more slowly than the Multiband sections, primarily
because of the nature of each function. Remember that the WB-AGC section operates on the program’s RMS
energy. During gain calculations, the incoming program’s average level is established, and gain adjustments,
if needed, are made based on those calculations. In this situation, the WB-AGC sections will appear to move
slower as it makes changes over relatively long time periods.
The intent of the Multiband section is to normalize the spectral balance and provide control of the peak
levels. Peak energy must be detected and adjusted in a quick and accurate manner while, at the same time,
not interfering with the sonic integrity of the audio signal. For this reason, the Multiband sections operate
faster, with special background instructions to govern their behavior, and strictly on an as-needed basis.