Grass Valley DD35 Family v.3.1.5 User Manual
Page 162
3. Menu Operation
DD35 Production Switcher
3 – 10
Operating Instructions – Rev. 16 / 10.2001
3.2.5
BAR GRAPHS
A bar graph visualizes parameters with a continuous (analog) range of values. A
bar graph is also used to adjust settings with a number of distinct values. It is as-
sumed that the average user associates a potentiometer and not a switch with the
setting.
A bar graph has the control state relevant/irrelevant and delegated/nondelegated
which is represented optically. A bar graph in the delegated state is represented
a blue color. An nondelegated diagram is shown in black and an irrelevant diagram
shows only the frame and the text in grey color. The column and the numerical val-
ues are not shown.
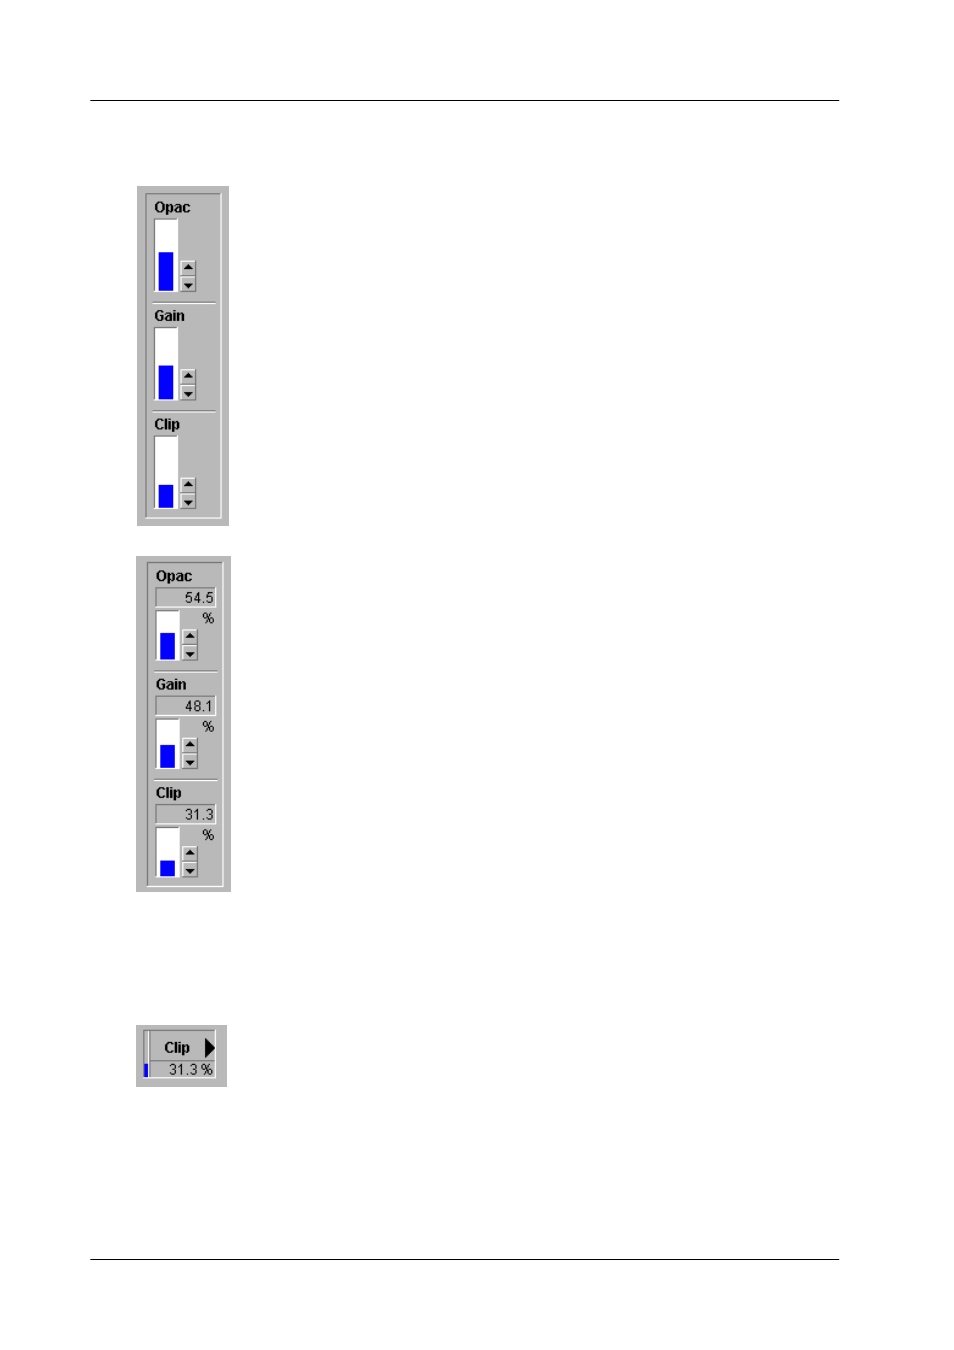
Bar graphs in bar view mode
Bar graph in digit view mode. The bar graph contains the numerical value and the
unit of the parameter. A mouse click into this field enables numeric entry via a key-
board connected to the panel.
3.2.6
DIGIPOT DESIGNATOR
A digipot designator is a control element which is used to describe the digipot func-
tion. It is represented in the digipot area on the right side, in each case in the height
of the pertinent digipot. The inscription changes if another group is selected.
A numeric digipot designator has a small bar to give an overview of range and ac-
tual position of the value. This bar cannot be operated with the mouse, but you can
enter the numeric value via the keyboard.
If the user turns the digipot slowly, it works in a linear mode. This means that the
number of increments is proportional to the rotated speed of the digipot. If the user
turns the digipot fast, the function will be nonlinear (e.g. quadratic).