Monitoring itx services – Grass Valley iTX System v.2.6 User Manual
Page 274
Using iTX Desktop layouts for system administration
Monitoring iTX services
Once you have configured the Engineering layout for your system, you can quickly see the
operational status of all the key iTX services that are running. You get this information from the
service status indicators on this layout.
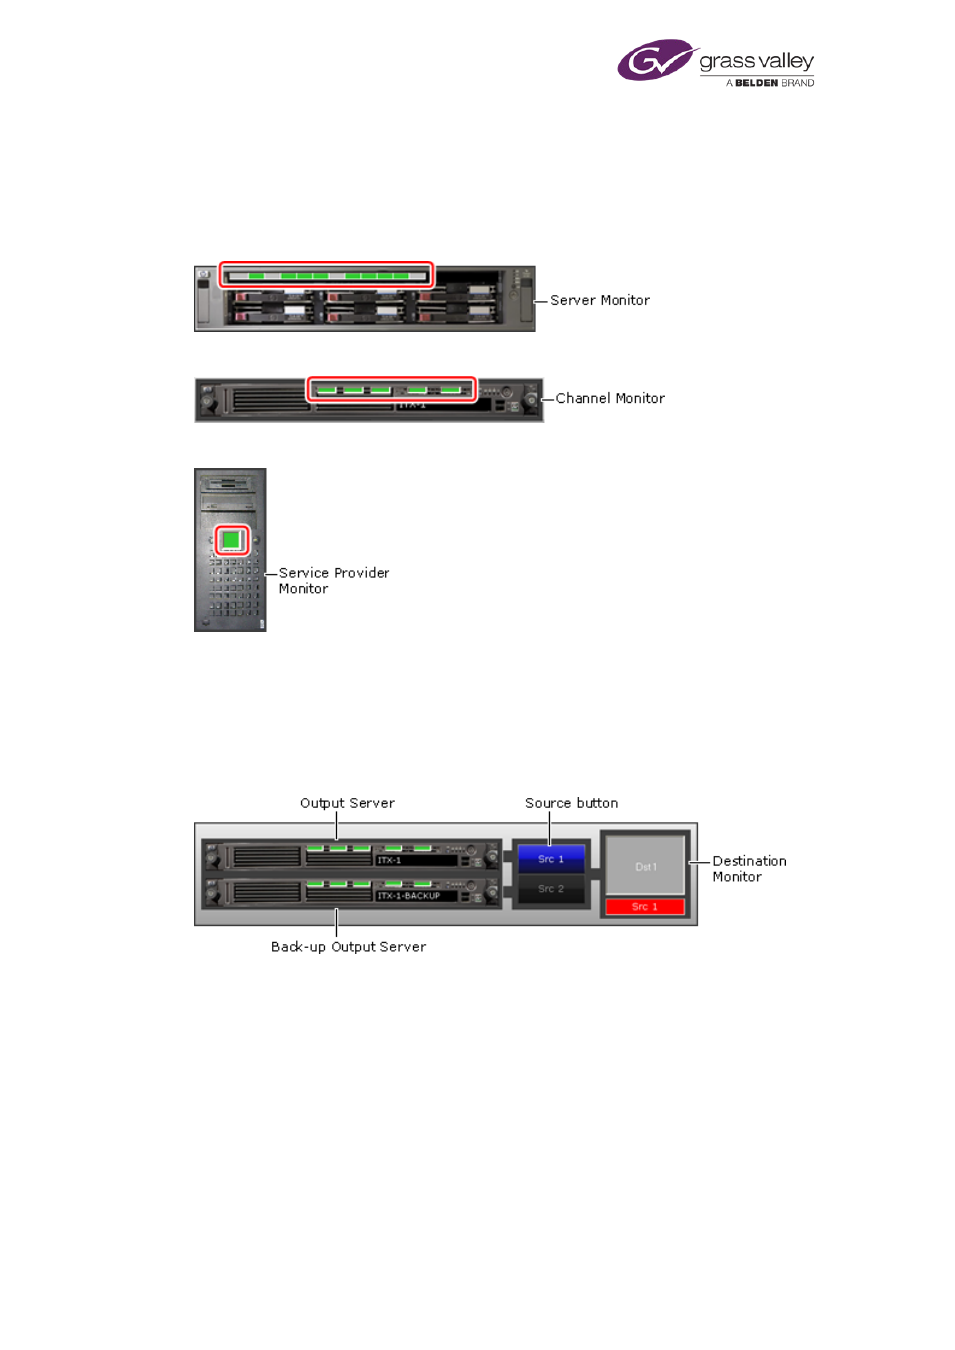
The Server Monitor has indicators for services on the Database Server machine:
Channel Monitors have indicators for services on Output Server machines:
A Service Provider Monitor has an indicator for any selected service (e.g. a Media Watcher):
about service-status indicators, page 110.
Selecting a different playout source in a transmission chain
A group of layout features show the transmission chain for a channel, with main and back-up
Output Servers:
For each Output Server, there is a router source button. The Destination Monitor represents
the transmission system that iTX delivers its output signal to.
When iTX is set up to operate a matrix router, the buttons are mapped to the router sources
that the Output Servers are connected to. You can route either Output Server to the
transmission system by clicking the associated source button. The UMD in the bottom of the
Destination Monitor shows the name of the connected source.
If iTX is not set up to operate a matrix router, the source buttons are configured for the
hardwired router – a software device that you use to update iTX when primary and back-up
Output Servers swap roles outside of iTX control. To prompt an update, the buttons should be
operated when you manually failover an Output Server, so that they always show which is the
live channel in the transmission chain.
March 2015
System Administrator Guide
Page 274 of 404