2 calibrating the concentration measurement – K-Patents PR-33-AC User Manual
Page 30
24
PR-33-AC instruction manual
Document/Revision No. Rev. 1.02
Effective: June, 2014
does not improve the noise performance. It should also be noted that increasing the
damping time will deteriorate the response speed of the instrument. Figure 6.1 shows
how the damping time affects the measurement.
6.2 Calibrating the concentration measurement
ETHERNET
FIELD CALIBRATION
CHEMICAL CURVE
n
D
CCD
TEMP
Pt-1000
CONC
CALC
1.
2.
3.
4.
5.
6.
DAMPING
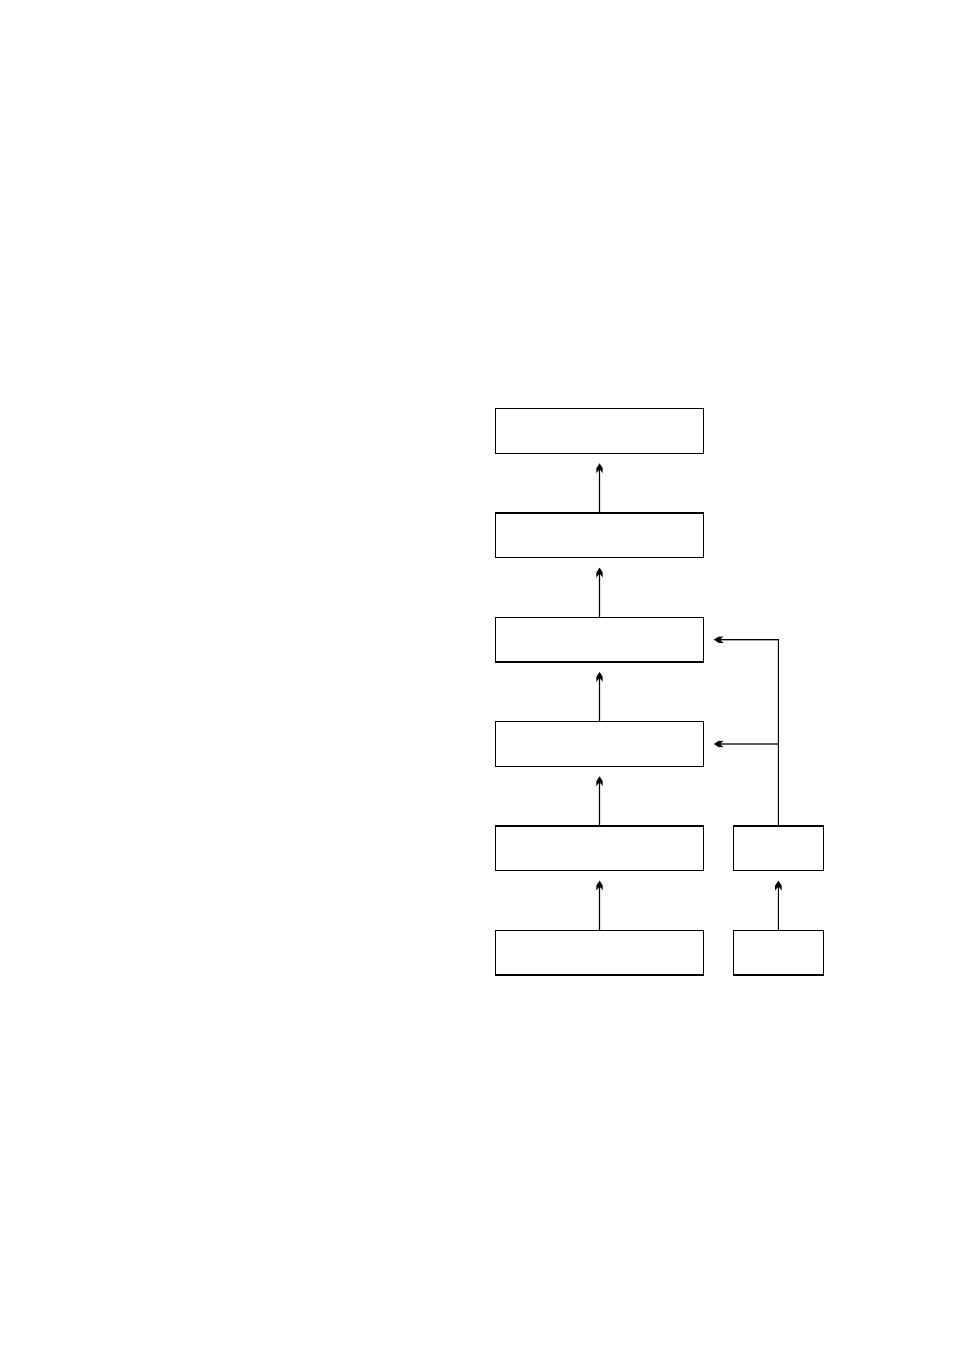
Figure 6.2
Calibration layers
The concentration calibration of the
K-Patents inline refractometer PR-33
is organized in six layers.
1. The information from the CCD
element and the Pt-1000 tem-
perature element. The position
of the shadow edge (Figure 10.3,
“Optical image detection”) is de-
scribed by a number called CCD
and scaled from 0-100 %.
2. The refractometer calibration:
The actual refractive index n
D
is
calculated from the CCD value.
The process temperature is cal-
culated from the Pt-1000 resis-
tance. The refractometer output
is n
D
and temperature TEMP in
Centigrade. Hence, the calibra-
tions of all Sanitary OEM Refrac-
tometers are identical, which
makes the refractometers inter-
changeable.
Furthermore, the
calibration of each refractome-
ter can be verified using stan-
dard refractive index liquids, see chapter 7.
3. The chemical curve: The refractometer calculates the Brix value based on n
D
and
TEMP. The result is a temperature compensated calculated concentration value
CALC.