Measurement Computing eZ-Analyst rev.14.1 User Manual
Page 113
Advertising
eZ-Analyst
988191
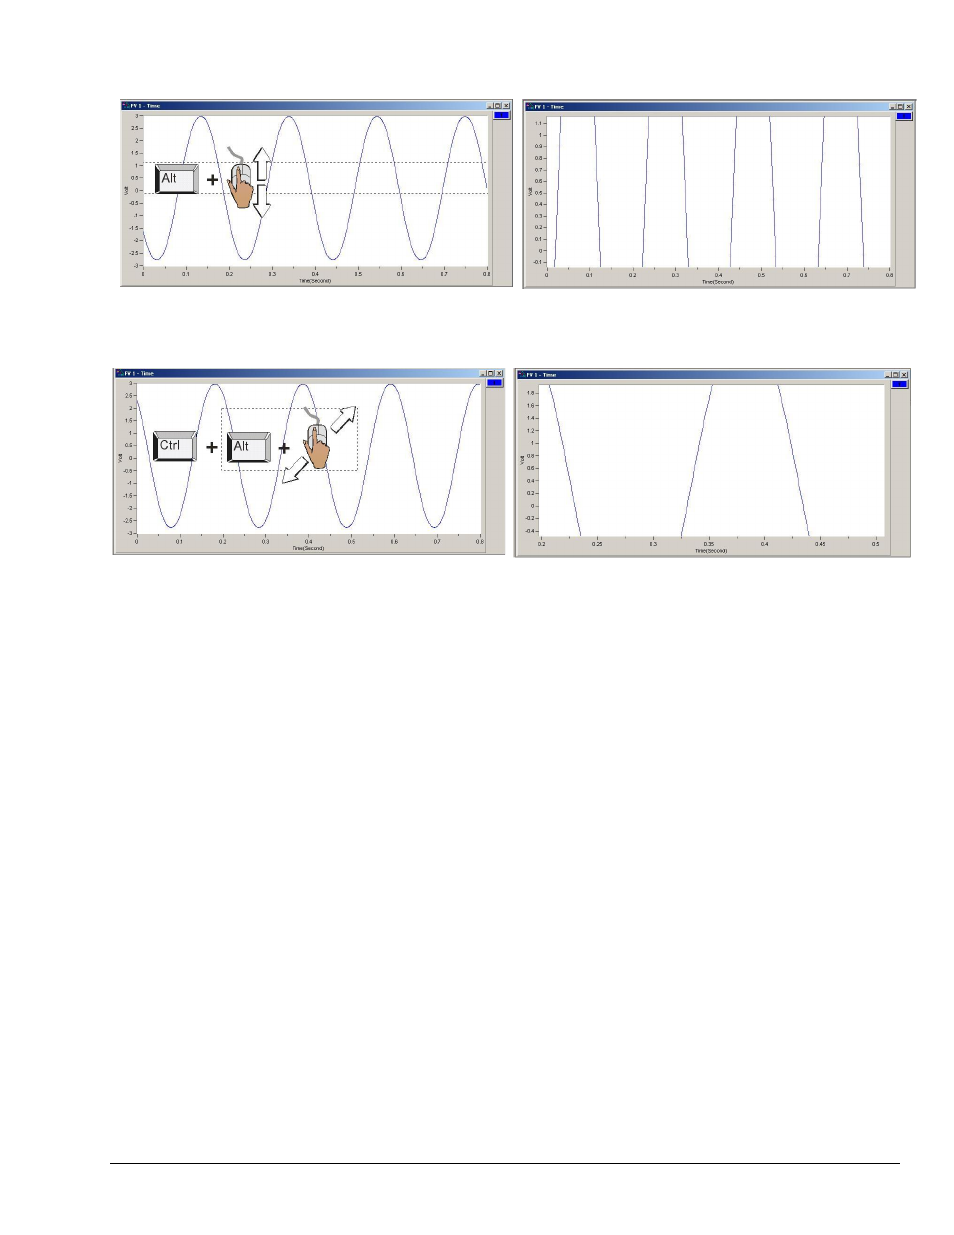
Interactive Plot Display 6-11
To change the Y-Axis: Hold down the <Alt> key, at the same time, left-click and drag the mouse cursor
vertically on the plot. Two horizontal cursor lines will define the new Y-axis end-points.
To simultaneously change the X & Y Axes: Hold down the <Ctrl> and <Alt> keys, at the same time,
left-click and drag the mouse cursor diagonally on the plot. A rectangle will define the new area of the plot.
Advertising
This manual is related to the following products: