Measurement Computing eZ-Analyst rev.14.1 User Manual
Page 130
A-4 Keyboard Controls
878193
Appendix A
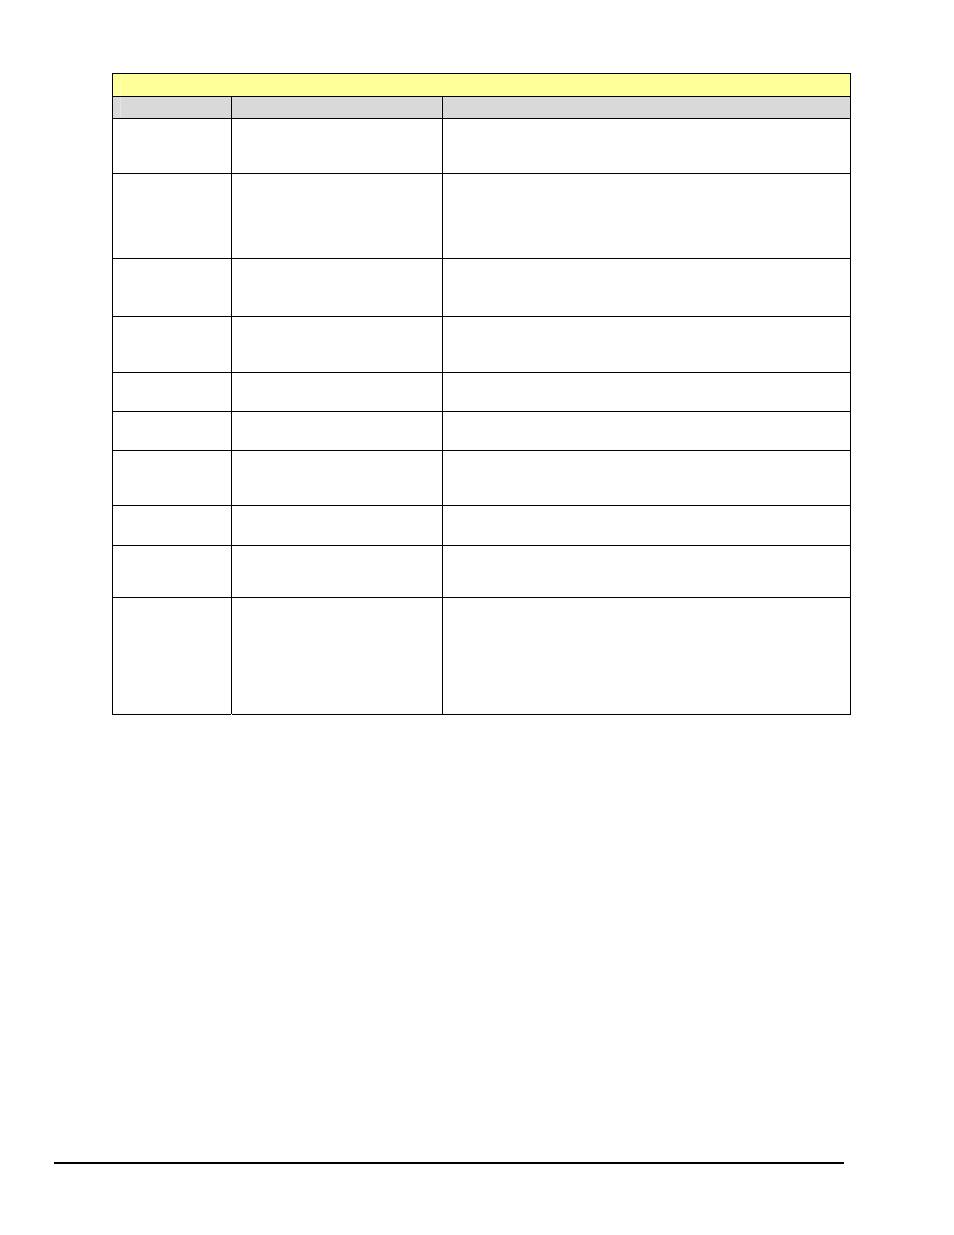
Slice View Control
Note that the use of keys in this table assumes that the Slice View has focus.
Keys
Function
Comments
<Home>
Resets the Playback record
pointer to the first record.
-----
A
Autoscale / Manual Scale
Toggles between Autoscale and Manual scale. Manual
scale values are the ones you enter into the Value Input
boxes near the ends of the X & Y axes. The Value Input
boxes [for minimum or maximum values] open when you
click to the left or below the plot window.
L
Linear Scale / Log Scale
Toggles between Linear (Lin) and Log scaling.
R
Reset
Resets the plot display window and the playback record
pointer to the first record.
,
(comma)
Move Left, 1 Record
Moves the record pointer one record to the left.
.
(period)
Move Right, 1 Record
Moves the record pointer one record to the right.
+
Zoom-in
Zooms in to the display in the area around the record
pointer.
-
Zoom-out
Zooms out from the display.
<Ctrl>
Manual Zoom
Hold down the <Ctrl> Key then click and drag the mouse
in the plot window to zoom in on the area covered by the
drag operation.
Mouse
Click
Y and X axes, Scale
minimum and maximum
To change the x or y scale values of the Slice View
display: Click the mouse with the cursor positioned in the
x or y axis border region. You must click near the
maximum or minimum value of the associated axis scale.
A value box will open. Key in the newly desired minimum
or maximum value for x or y. Repeat for other axes
values as desired.