Grass Valley Kaleido-Solo Installation v.5.00 User Manual
Page 58
GUIDE TO INSTALLATION AND OPERATION
54 | Kaleido-Solo
Chart Configuration - Position
Move all loudness charts to the desired position on the screen:
Top Left
Top Center
Top Right
Bottom Left
Bottom Center
Bottom Right
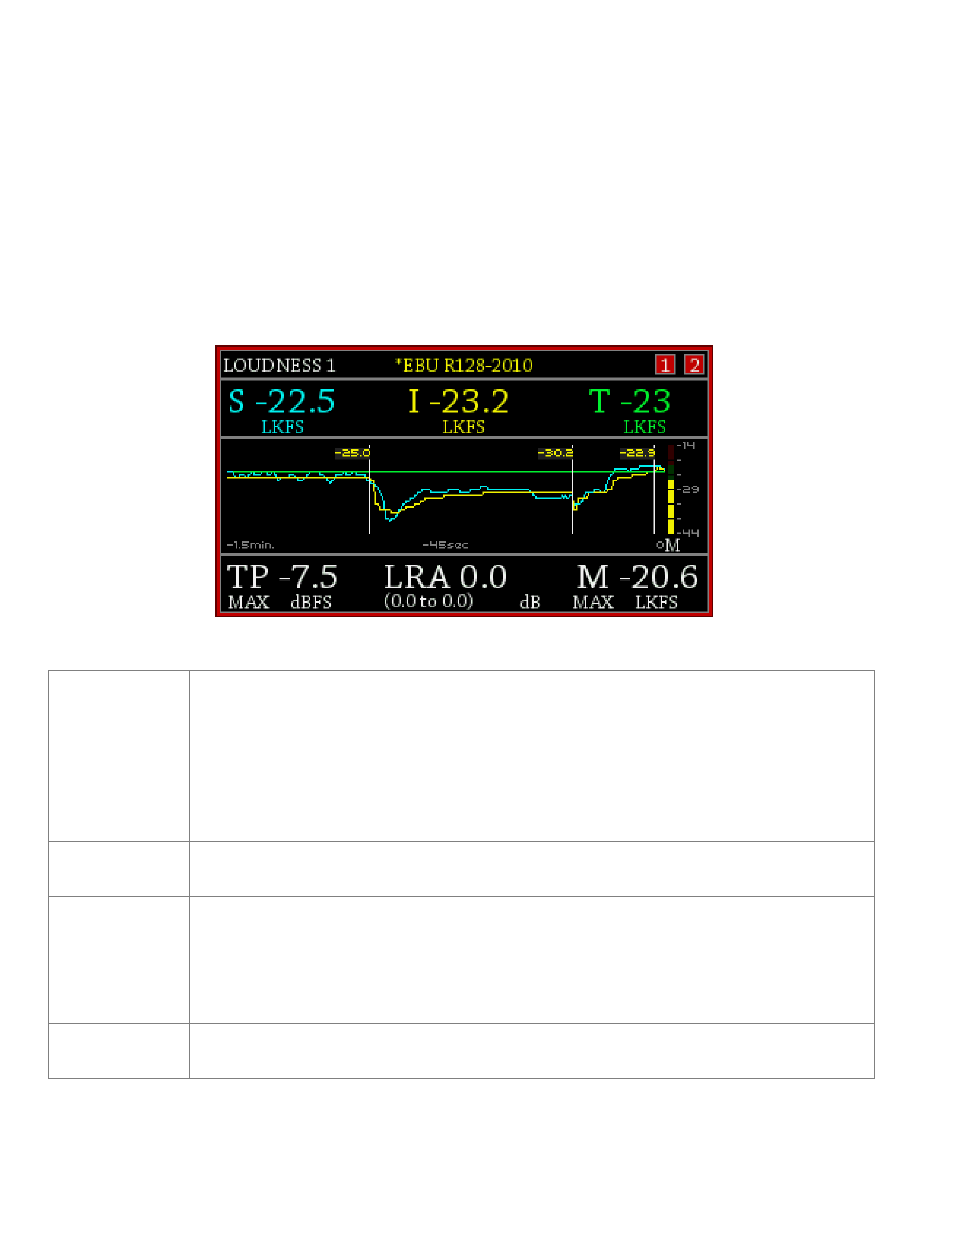
Loudness chart (Meter)
The color identifies the traces (center section) with their numeric values (top section).
Top and Bottom
sections
Refer to EBU R128, ATSC A/85 or ARIB TR-B32 specification for more details.
S:
Short term, since last reset.
I:
Integrated, since last reset.
T:
Target.
TPmax:
Maximal true peak, since last reset.
LRA:
Loudness range.
Mmax:
Maximal Momentary, since last reset.
Top right corner
Shows if the alarm condition is triggered (RED) by the measurement 1 and/or 2. Both charts are
active at all times, but only one can be displayed at a time.
Center section
Graphic representation of the short term and integrated measurements and the target value.
The time scale is shown at the bottom of this section. The three traces can be independently
shown or hidden (see section 5.5.2
). The “EBU Mode or A85 Mode” is displayed only when the
measurements are compliant with those specifications (see section 5.4.6). Markers appear
when an audio loudness control reset is applied (see section 5.4.7). The integrated value for the
segment will appear next to the marker.
Center right
section
Meter that represents the momentary measurement.