Flowserve ValveSight Diagnostics User Manual
Page 21
ValveSight Diagnostics for HART User Manual FCD VSENSF0001-02-AQ 03/15
21
flowserve.com
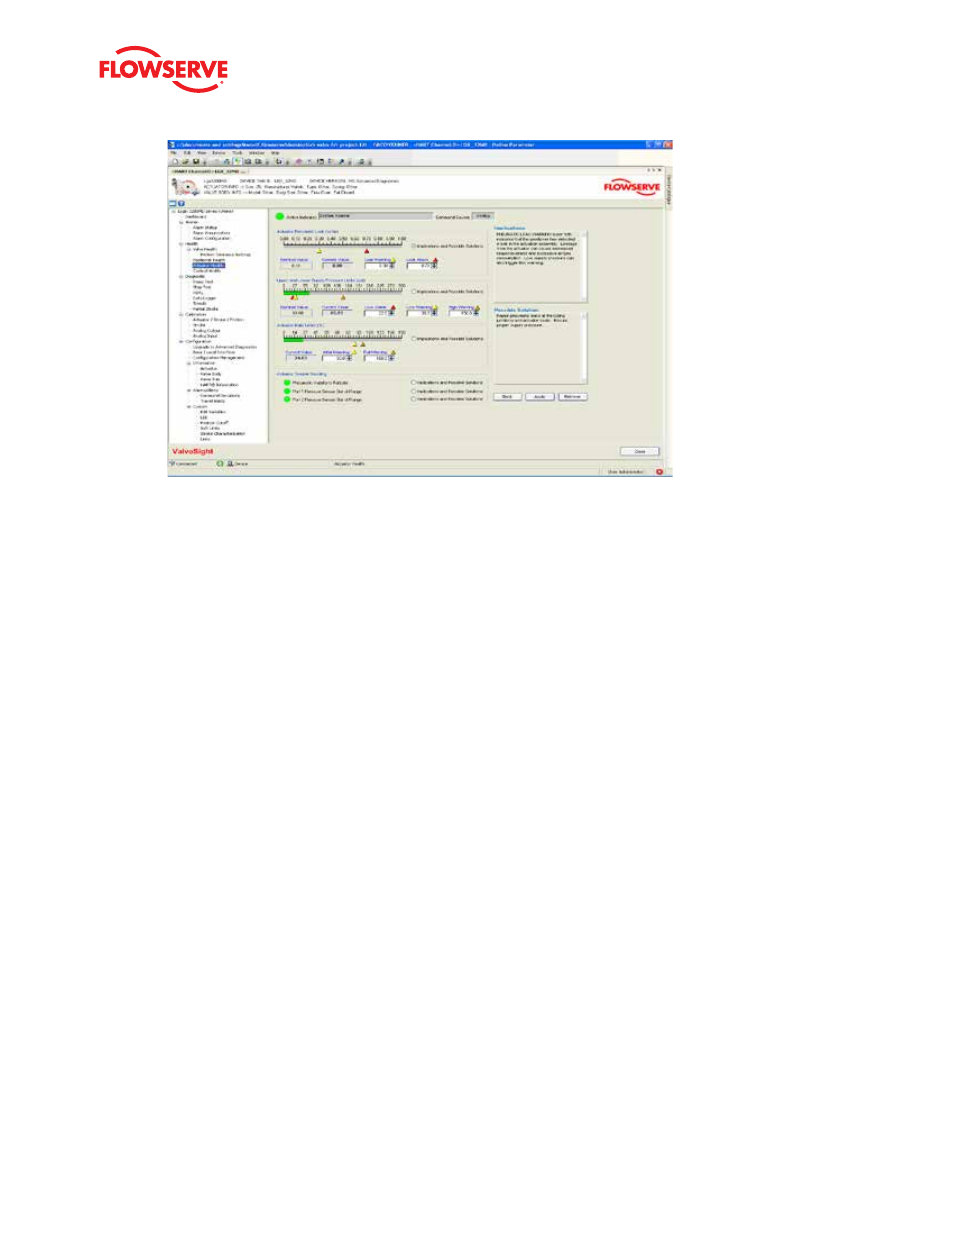
Actuator Pneumatic Leak
The pneumatic leak is displayed on the first graph and in the “Current Value” and “Nominal Value” display boxes. The
Nominal Value is the value stored in memory on the positioner and is updated every 10 minutes. It represents the
pneumatic leak (not counting the normal air/gas consumption of the positioner). This indicator reflects leaks in Port 1,
Port 2, or across the actuator O-ring. Two limits are set and also adjustable. As the leak value passes the Leak Warning
limit, the Actuator Heath bar on the Dashboard will begin to turn Yellow and a warning will be sent in response to a HART
command 48. As the leak value passes the Leak Alarm limit, the Actuator Health bar on the Dashboard will turn red and
an alarm will be sent in response to a HART command 48. To adjust the limits use the page up/down buttons on your
keyboard or use the mouse to click on and slide the limit indicators on the graph. Press the
Apply button at the bottom of
the screen to activate the new limits to the positioner.
Supply Pressure
The supply pressure is displayed on the graph and in the “Current Value” and “Nominal Value” display boxes. The Nomi-
nal Value is the value stored in memory on the positioner and is updated every 10 minutes. It represents the pneumatic
leak (not counting the normal air/gas consumption of the positioner). Three limits are set and also adjustable. As the
supply pressure value drops below the Low Warning limit, or above the High Warning limit, the Actuator Health bar on
the Dashboard will begin to turn yellow and a warning will be sent in response to a HART command 48. As the supply
pressure value passes the Low Alarm limit the Actuator Health bar on the Dashboard will turn red and an alarm will be
sent in response to a HART command 48. As the value passes the Full Warning limit the Actuator Health bar on the Dash-
board will turn completely yellow. To adjust the limits, use the page up/down buttons on your keyboard or use the mouse
to click on and slide the limit indicators on the graph. Press the
Apply button at the bottom of the screen to activate the
new limits in the positioner.
Troubleshooting - The status of diagnostic indicators is displayed at the bottom of this screen. These indicators also
affect the health status bars on the Dashboard. Select the
Implications and Possible Solutions button to view additional
information about these positioner indicators.