Water history, Climate logic, 81% history – Irritrol Climate Logic User Manual
Page 17: 17 water history review feature
Water History Review Feature
17
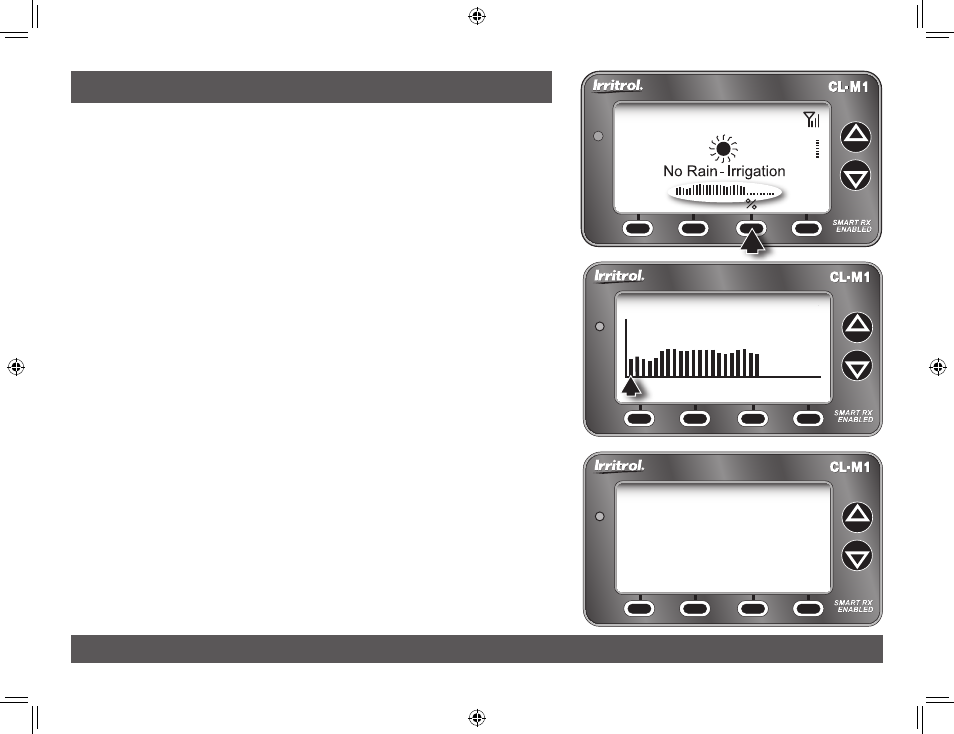
Water History Review Feature
The Climate Logic system tracks and records the daily adjust-
ment factor for a rolling, two-year period. A one-month snap-
shot is represented by the small bar graph on the Home screen.
The graph is updated daily, and builds from the left to right,
with the most recent day appearing on the left of the scale.
Pressing the % key displays the Water History graph in a
large-scale format. By default, the graph represents the daily
adjustment history for a one-month period. Pressing the
ZOOM
key displays the history data in time frames of approximately
2-months, 6-months, 1-year, and 2-years.
Watering history data can also be reviewed in a contextual
format, accessible through the History option of the Utility
Menu.
(MENU _
UTILITY _
HISTORY).
The History screen lists the date and adjustment % value for
each day in chronological order, with the most recent entry at
the bottom. Use the
NExT
and
BACK
keys to scroll through the
data screens.
Note: Data displayed in the
LOGfILE
screen is provided for service
use only.
WATER HISTORY
EXIT
1 MONTH
100
ZOOM
. . . . . . . . . . . . . . . . . . . . . . . . .
.
CLIMATE LOGIC
MENU
10:32
a
06/21
89
F
81%
History
EXIT
06/14/11 82%
490606001D
06/15/11 80%
4917630056
06/16/11 84%
49260600F0
06/17/11 88%
4936E30016
06/18/11 89%
494806001D
06/19/11 82%
4959630050
06/21/11 81%
4959A30056
BACK
LOGFILE
NEXT
CL User Guide Final Edit.indd 17
2/11/11 5:19 PM