View graph of summary results, Use the test results, Open an existing test file – Retrotec FanTestic (ATTMA) User Manual
Page 48: 9 use the test results, 3 view graph of summary results, 1 open an existing test file
rev-2014-10-27
Page 48 of 58
©Retrotec Inc. 2011-2014
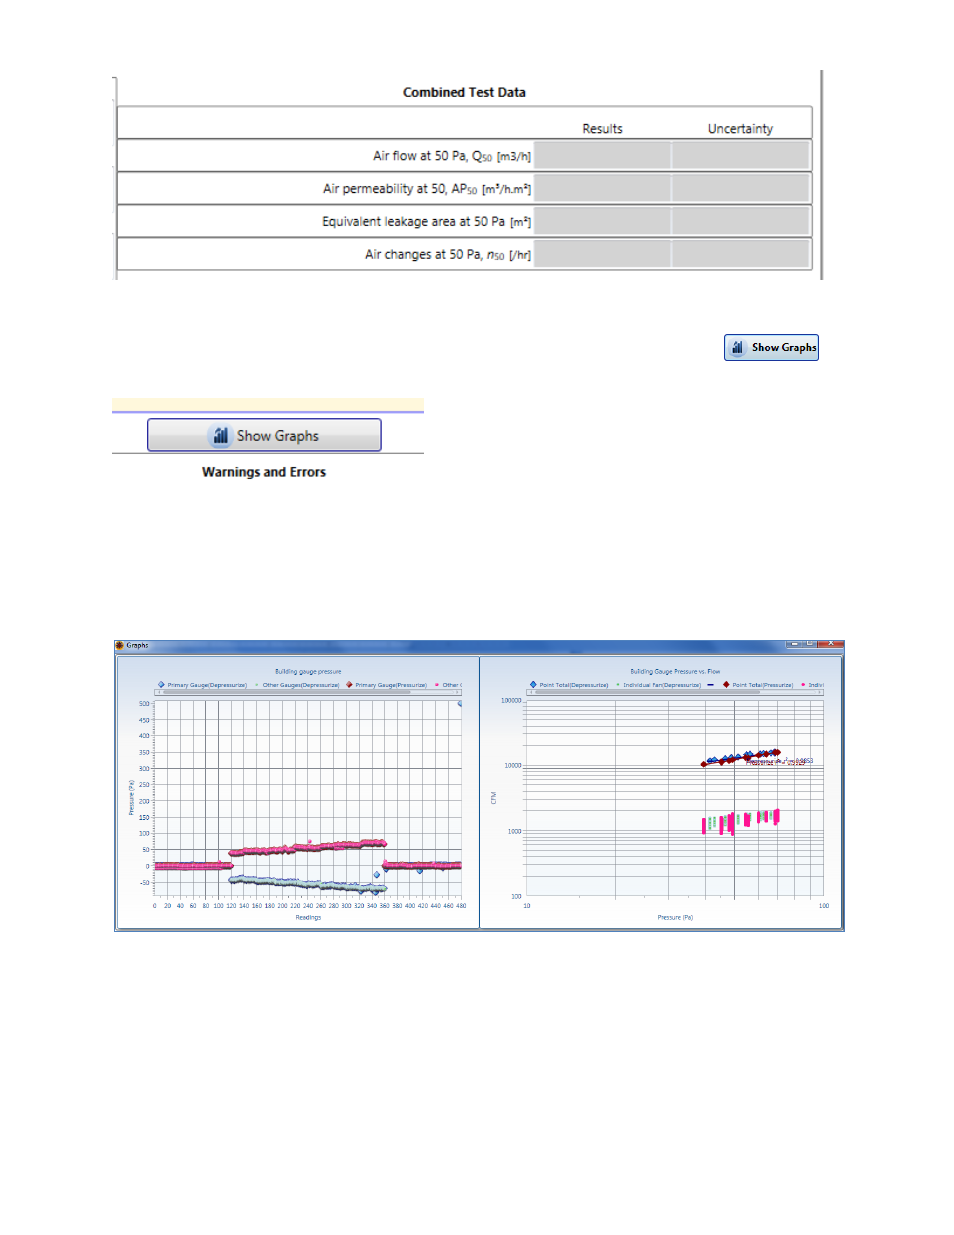
8.3 View Graph of Summary Results
FanTestic provides a graphical display of the test data collected, opened by clicking the
button in the Summary Results section below the combined Mean or Reduction calculated test results.
The graphs will open in a new window that can be opened and closed at any time. Two graphs will be
displayed.
The graph on the left shows the pressure readings (Pa) from the gauges. The graph on the right shows
the total fan flow rate (CFM or other flow units) plotted against building pressure on a logarithmic scale.
The right hand graph also shows the ideal (regression) line based on the data points, and the individual
flow rates from all the fans that are included in the total.
9 Use the Test results
9.1 Open an existing Test file
To open a test file that has already been completed and saved, there are several options:
The main opening screen for FanTestic displays can display previously completed tests in the
“Test History” pane on the left hand side (with a photo of the building, if it was included when