Pm history – Solare Datensysteme Solar-Log User Manual
Page 58
58
Operating via a web browser within your own network
PM History
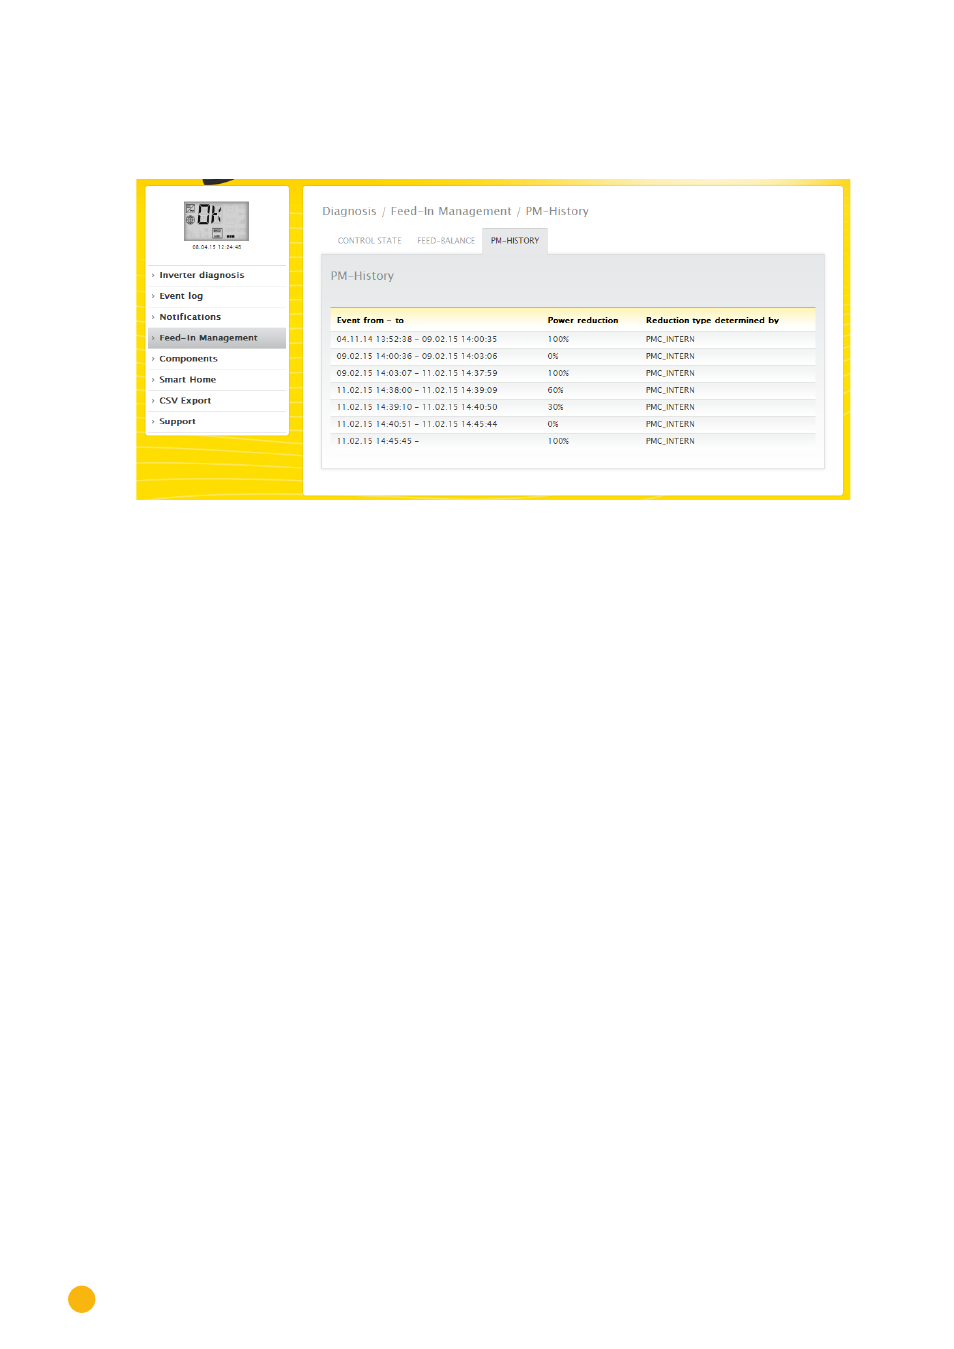
The power reductions are displayed in a table with three columns in the
PM History
tab.
Fig.: PM History
•
Event from - to:
•
The time and date that a power reduction was activated.
•
Power reduction type determined by:
Possible values in this column:
•
PMC_NONE
•
PMC_DIAG
•
PMC_MODBUS_2
•
PMC_MODBUS_1
•
PMC_PROFILE
•
PMC_INTERN
•
PMC_DIRECTM
(For an explanation, refer to the section: "
Explanation of the Values in the Power Reduction
" in
Power reduction type determined by").
•
Power reduction:
•
The power reduction as a percentage.
Two additional tabscan be accessed in the Feed-In Management menu (as long as the devices are con-
nected):
•
Utility Meter
•
I/O Box
There is a detailed guide for this in the "Special Functions | Power Management" chapter of the Installation
Manual.