5�4�6 overall graph – Solare Datensysteme Solar-Log User Manual
Page 96
Advertising
96
Operating the Solar-Log 500 and 1000 via the Display
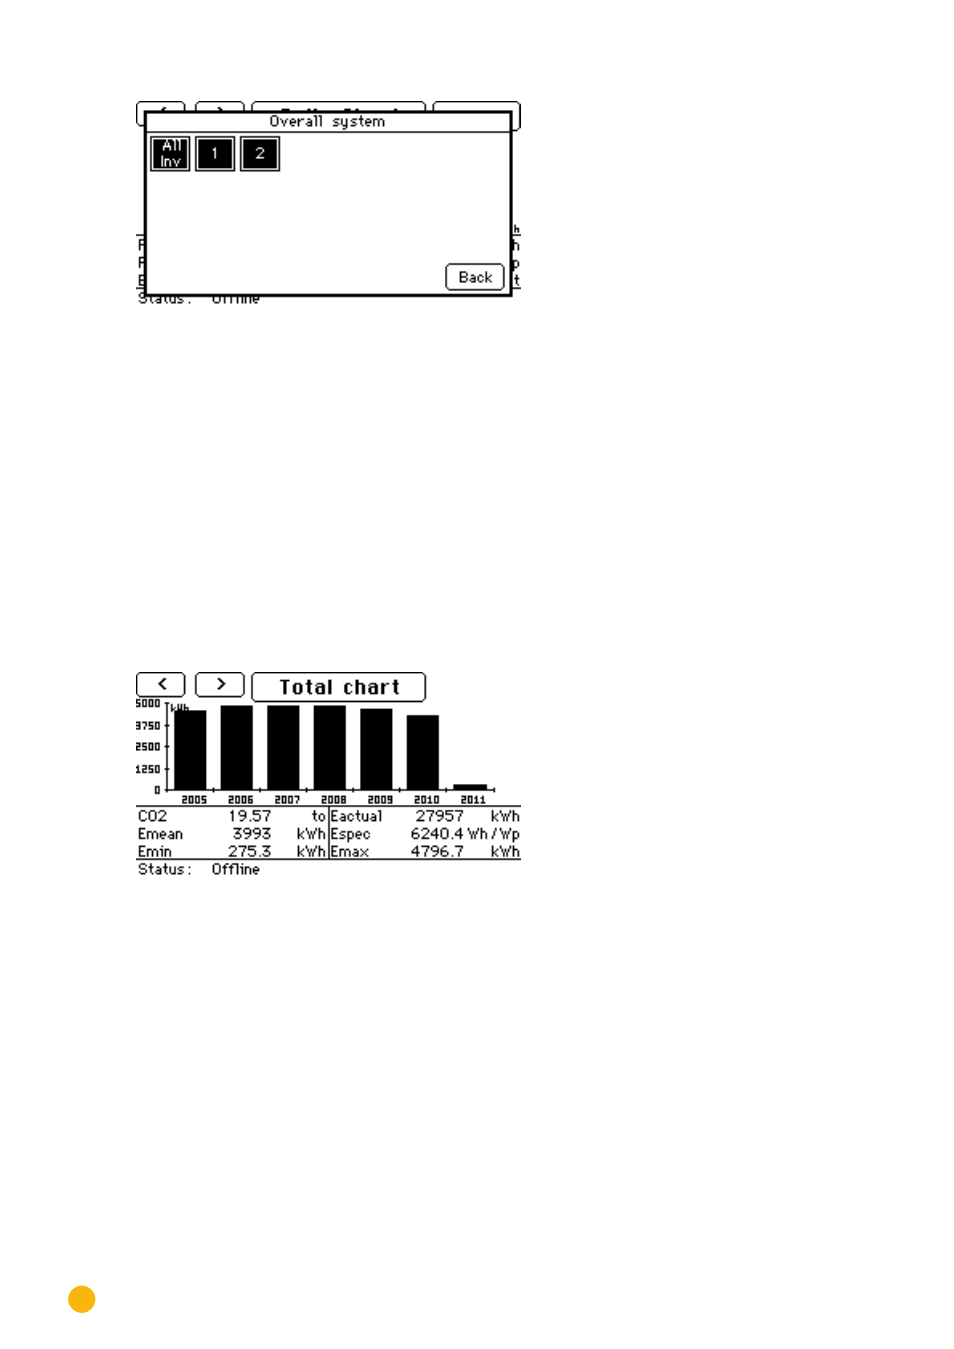
Fig.: Total Plant
Select the desired inverter and tap on "
Back
."
•
The values from the selected inverter are displayed.
Tap
on the display to access the Main Navigation.
5�4�6 Overall Graph
Tap
your finger on the display.
•
The main navigation screen is displayed.
Tap
on
Graph
and then on the
Total
.
Fig.: Total Graph
The total graph displays the values for the plant since it has been monitored by the Solar-Log™.
Tap
on the displayed bar to view the Yearly Graph for the selected year.
Tap
on the
Total Graph
to display the yield values for the connected inverters.
•
The total plant menu window is displayed.
Advertising