Solare Datensysteme Solar-Log User Manual
Page 67
67
Operating via a web browser within your own network
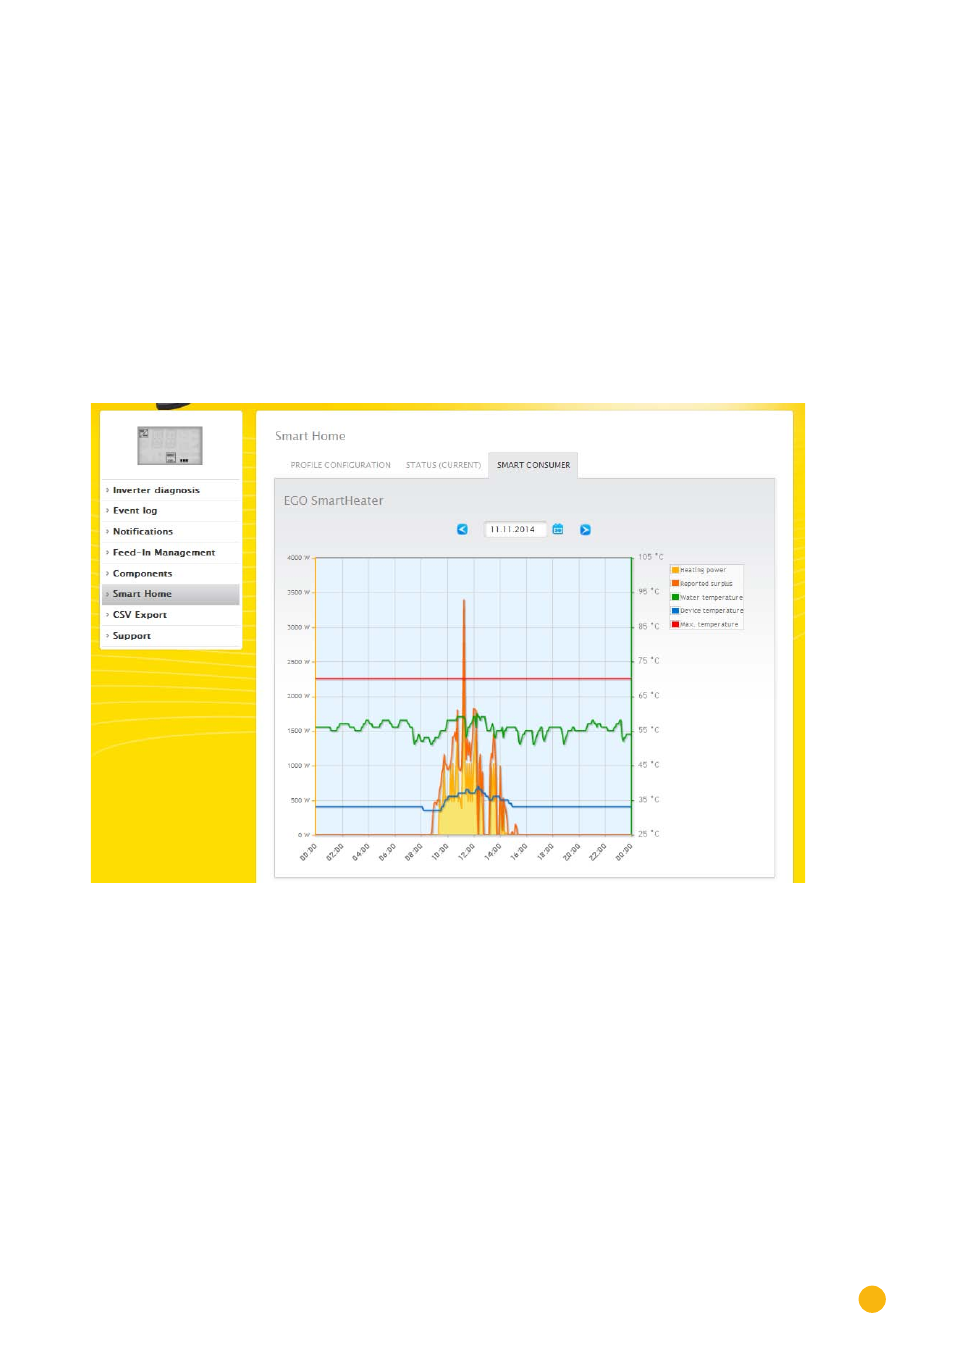
Smart Appliances
All of the available values are displayed as a current curve graph in the tab Smart Appliances.
The following values are displayed with a EGO Smart Heater as an example:
•
Heating power
The amount of energy supplied (in watts) to operate the heating rod.
•
Reported surplus
The amount of surplus power available from the PV plant.
•
Water temperature
The water temperature recorded at the particular time.
•
Device temperature
The temperature of the heating rod recorded at the particular time.
•
Max. temperature
The maximum heating temperature of the heating rod.
Fig.: Example plant with an EGO Smart Heater and displayed values
The
Date
box offers the option to select a particular day for viewing. The arrow keys can also be used to
move to the next or previous date.
The individual values, at the top-right of the graph key, can be displayed or hidden with a mouse click.
The following values are displayed in the curve for IDM heat pumps:
•
Power
The amount of energy supplied (in watts) to operate the heat pumps.
•
Reported surplus
The amount of surplus power available from the PV plant.