Solare Datensysteme Solar-Log User Manual
Page 117

117
Using Solar-Log WEB
Additional functions with the Sensor Box
The following displays are additionally available when a Sensor Box is connected to the Solar-Log™.
•
Solar: Displays the reference value from an irradiation sensor. The plant's daily output has to lie
within the range measured by the sensor.
•
M °C: Displays the module temperature. The temperature is by measured by the Sensor Box.
•
A °C: Displays the ambient temperature. This is measured by the ambient temperature sensor.
•
Wind: Displays the wind speed and strength. These values are measured by the wind sensor.
Click on the selection button and then on the magnifying glass icon.
•
The selected curve is displayed.
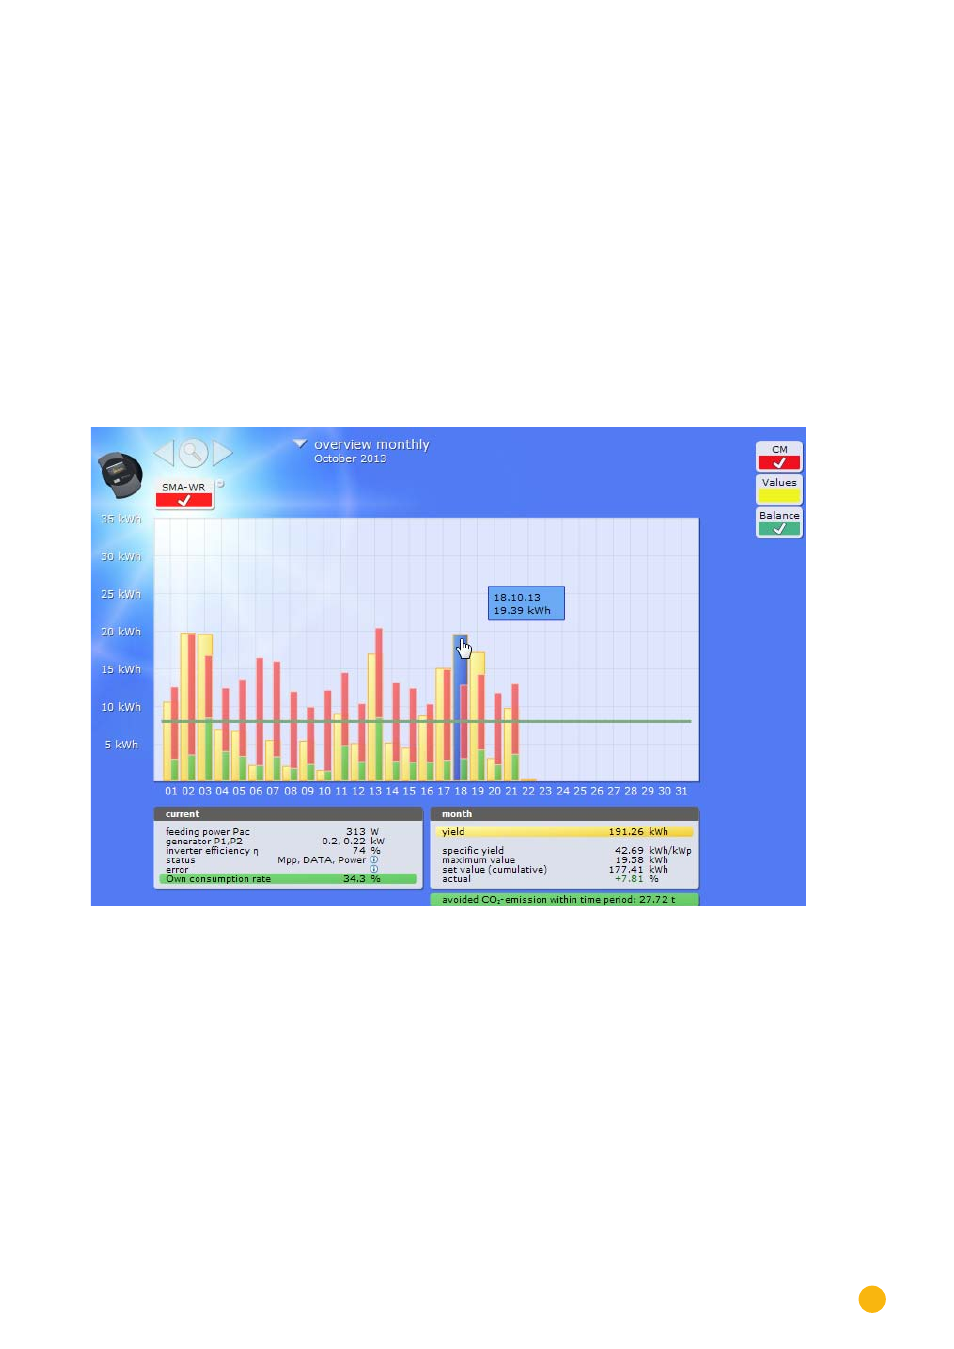
7�3�4 Monthly Overview
Select Monthly Overview from the navigation menu.
Fig.: Plant C2 - Monthly Overview
The daily yields from a month are displayed as a total in a bar graph. The dark green line indicates the
month's target yield.
Move the mouse above one of the day bars.
•
The yield from the selected day is displayed.
By clicking on a bar,
•
the corresponding curve is displayed.