2�5�1 day view – Solare Datensysteme Solar-Log User Manual
Page 18
Advertising
18
Operating via a web browser within your own network
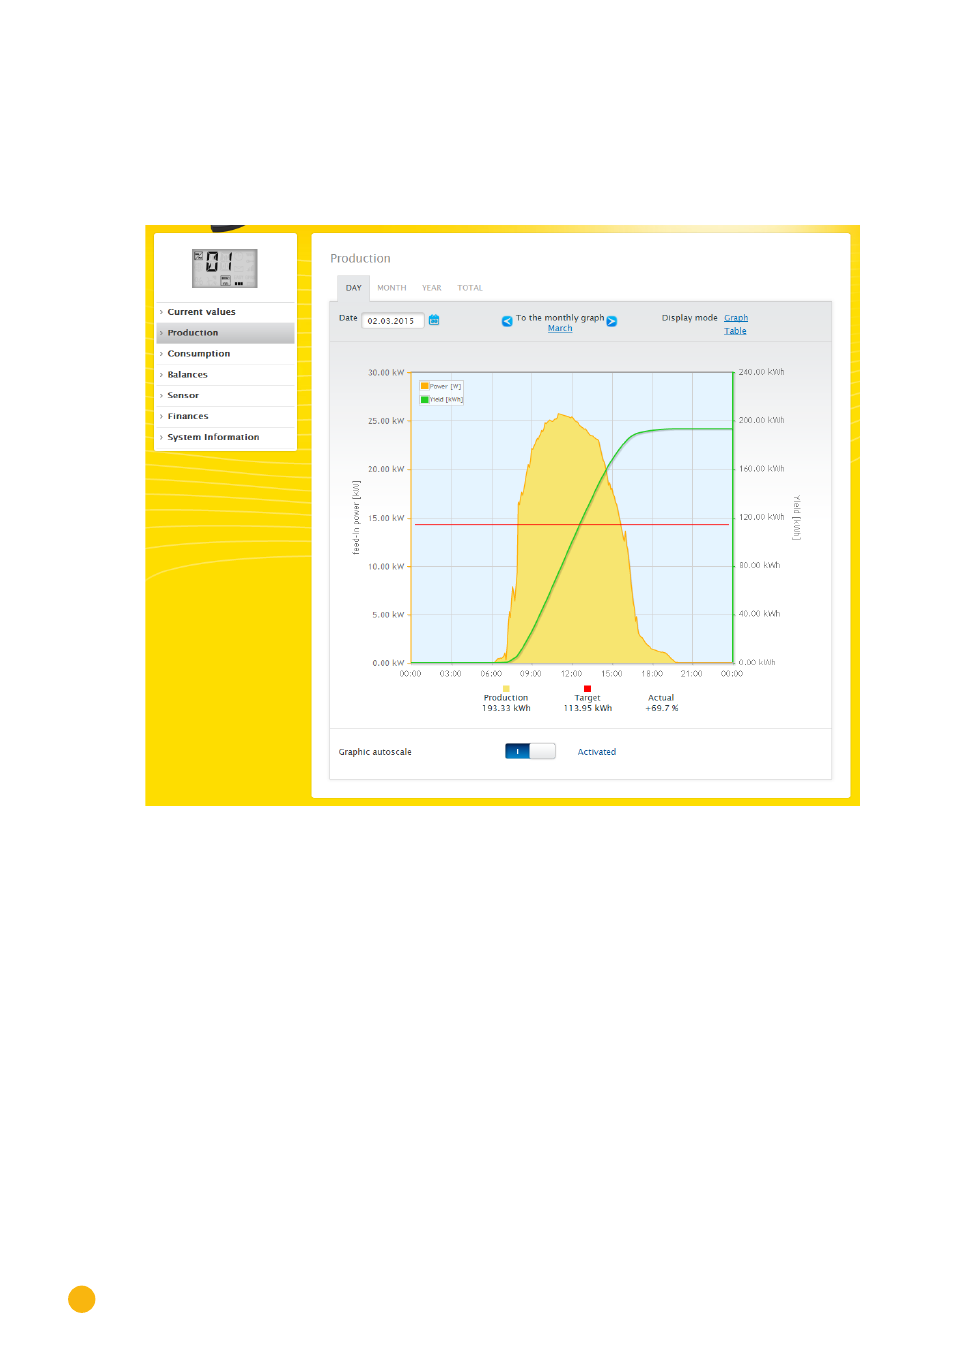
2�5�1 Day view
The
Day
tab displays the current day as a curve graph. The
output
(W) and
yield
(kWp) values, at the top
left of the graph key, can be hidden and unhidden by clicking on them.
The different values throughout the day can be displayed by moving the mouse along the curve.
Fig.: Daily View of the Production Graph with the Auto Scaling activated
Advertising