Solare Datensysteme Solar-Log User Manual
Page 43
Advertising
43
Operating via a web browser within your own network
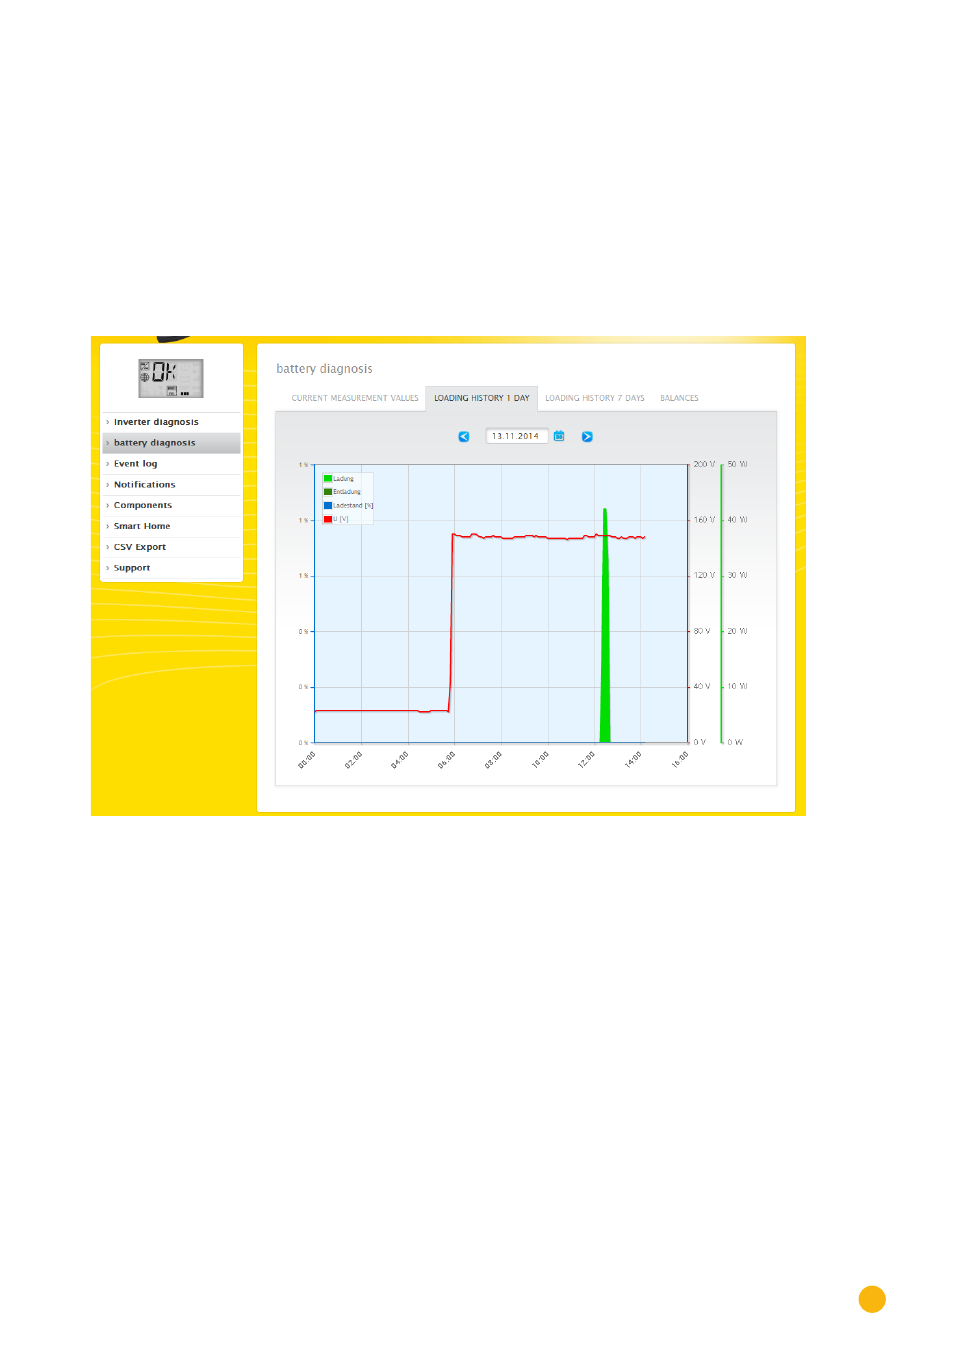
Charging History 1-Day
A daily graph with the following values is in the
Charging History 1-Day
tab.
•
Charge
The battery's charge levels throughout the day in watts.
•
Discharge
The battery's discharge levels throughout the day in watts.
•
Charge Level (%)
The battery's charge levels throughout the day as a percentage.
•
U (V)
The battery's voltage curve throughout the day in volts.
Fig.: Battery diagnosis - Charging History 1-Day
The
Date
box offers the option to select a particular day for viewing. The arrow keys can also be used to
move to the next or previous date.
The individual values, at the top-left of the graph key, can be displayed or hidden with a mouse click.
Advertising