9�5�2 monthly overview – Solare Datensysteme Solar-Log User Manual
Page 145
Advertising
145
Using the Solar-Log™ App iPhone V3 for iPhones
9�5�2 Monthly Overview
1.
Tap the screen.
•
The bottom menu bar is displayed.
2. Select Month to go to the monthly values.
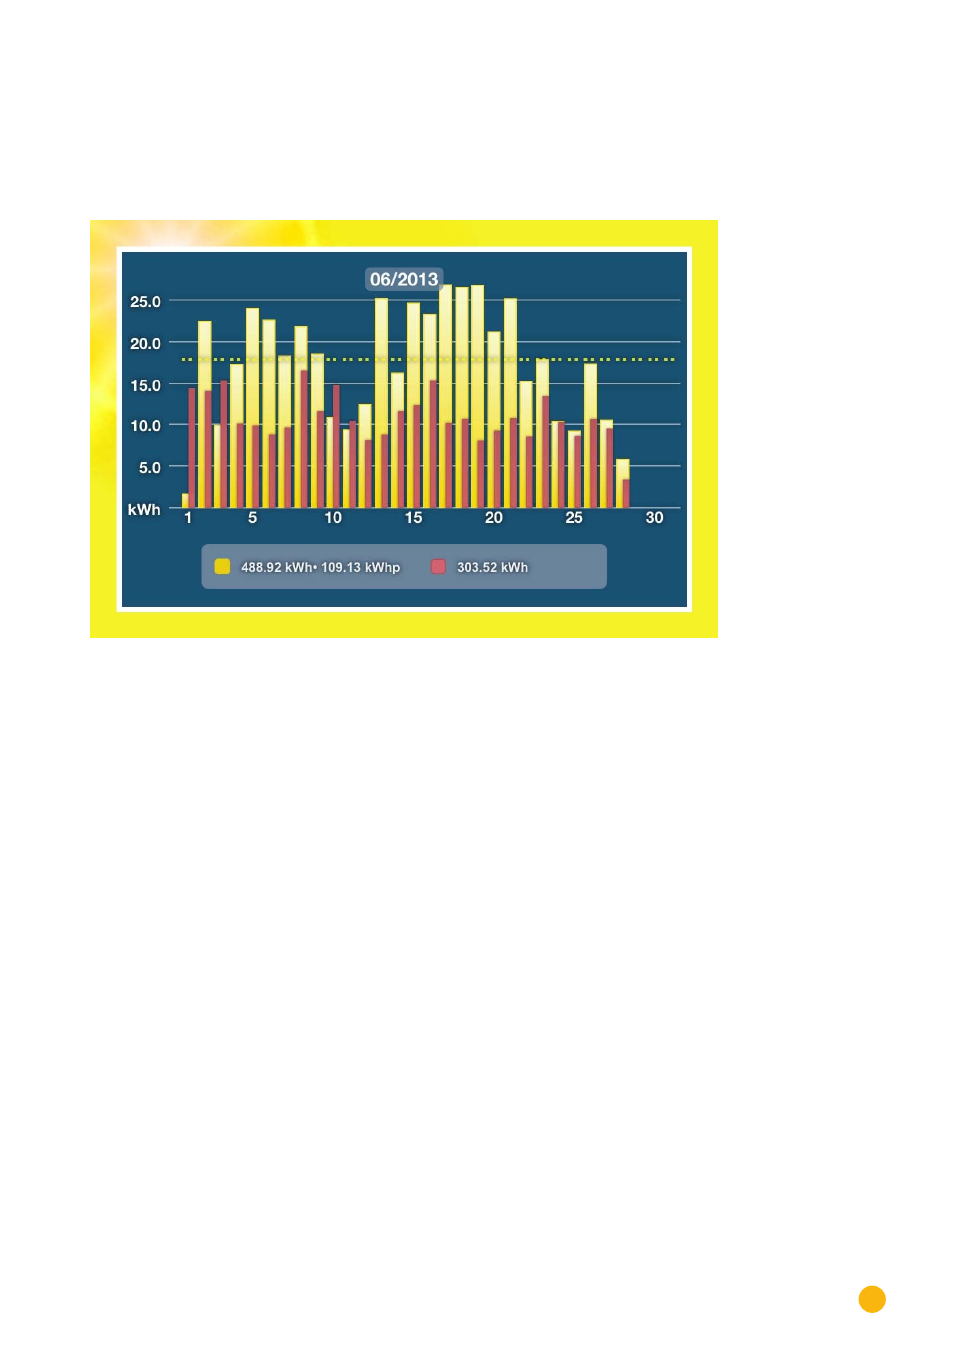
Fig.: Monthly Overview in horizontal format
The daily yields of the selected month are displayed as a bar graph. The dotted line in the view displays the
plant's calculated target value based on the annual forecast.
3. Swipe to the left to go to the next view or to the right to go back to the previous view.
4. Swipe up or down to change the module views.
Advertising