Xtramus NuApps-QoS-RM V1.1 User Manual
Page 49
Advertising
49
E-mail: [email protected]
Website: www.Xtramus.com
XTRAMUS TECHNOLOGIES
®
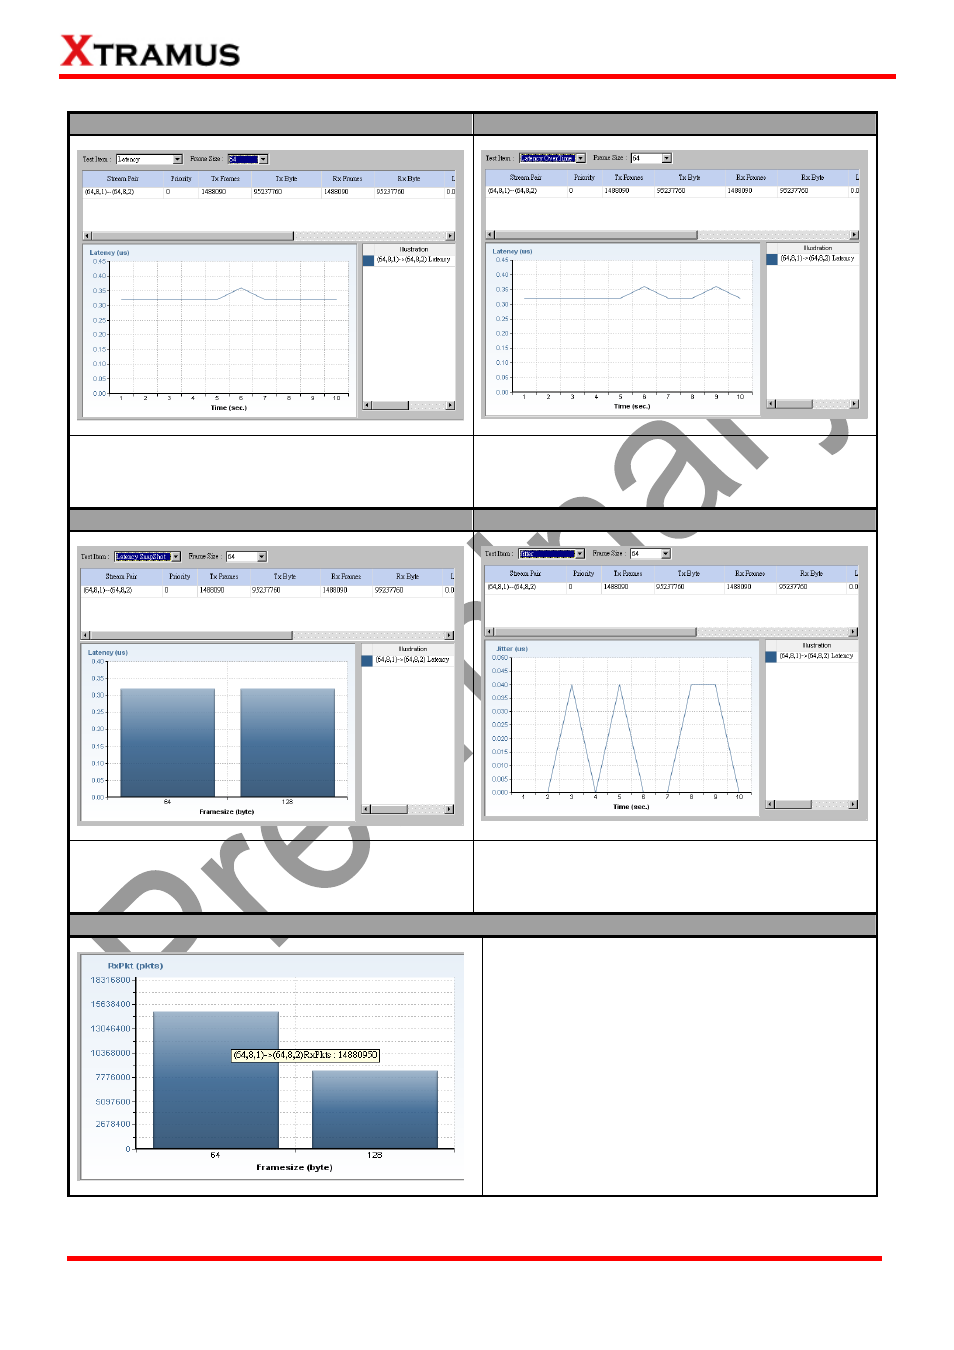
Latency
Latency Overtime
This chart uses Latency in Microseconds (μs)
as Y-axis, and time in seconds as X-axis.
This chart uses Latency in Microseconds (μs)
as Y-axis, and time in seconds as X-axis.
Latency Snapshot
Jitter
This chart uses Latency in Microseconds (μs)
as Y-axis, and Frame Size as X-axis.
This chart uses Jitter in Microseconds (μs) as
Y-axis, and time in seconds as X-axis.
Viewing Test Result Chart
To view detail statistics on the chart, please
move the mouse cursor to the part you would
like to know more, as shown in the figure on the
left.
Advertising