Overall efficiency, Best lineup, Most productive offense – Daktronics DakStats Basketball User Manual
Page 52: Most used lineup, Best free throw shooting
46
Creating Reports
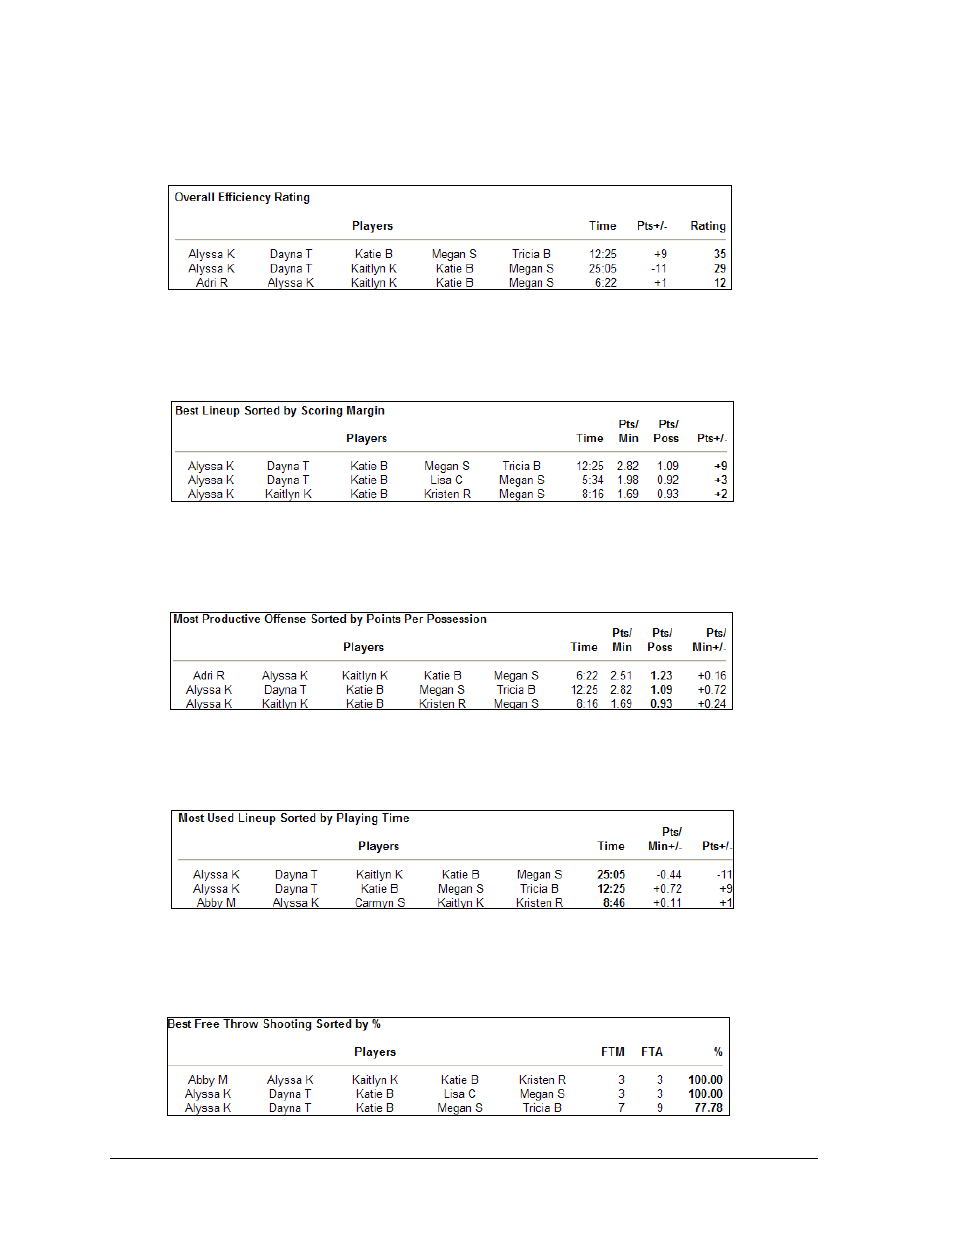
Overall Efficiency
The Overall Efficiency report (Figure 64) shows the group of players with more ‘positive’
actions (made shots, rebounds, steals, etc.) than ‘negative’ (missed shots, turnovers, etc.).
Best Lineup
The Best Lineup report (Figure 65) shows the group of players who made more points
themselves than let the other team make.
Most Productive Offense
The Most Productive Offense report (Figure 66) shows the group with the most points
scored per possession.
Most Used Lineup
The Most Used Lineup report (Figure 67) shows the group with the most time on the court.
Best Free Throw Shooting
The Best Free Throw Shooting report (Figure 68) shows the group of players with the
highest free throw shot percentage.
Figure 64: Overall Efficiency Rating
Figure 65: Best Lineup Sorted by Scoring Margin
Figure 66: Most Productive Offense Sorted by Points Per Possession
Figure 67: Most Used Lineup Sorted by Playing Time
Figure 68: Best Free Throw Shooting Sorted by %