Situational comparisons – Daktronics DakStats Basketball User Manual
Page 56
50
Creating Reports
With Kaitlyn on the court, either the group was not able to score as frequently or the
opposing team was allowed to score more often. This could be a result of poor performance
by Kaitlyn, superior performance by Tricia, or another factor that should be looked into.
Situational Comparisons
In addition to examining individual performance, lineup reports are a great way to find
variations within the same group of players across unique game situations.
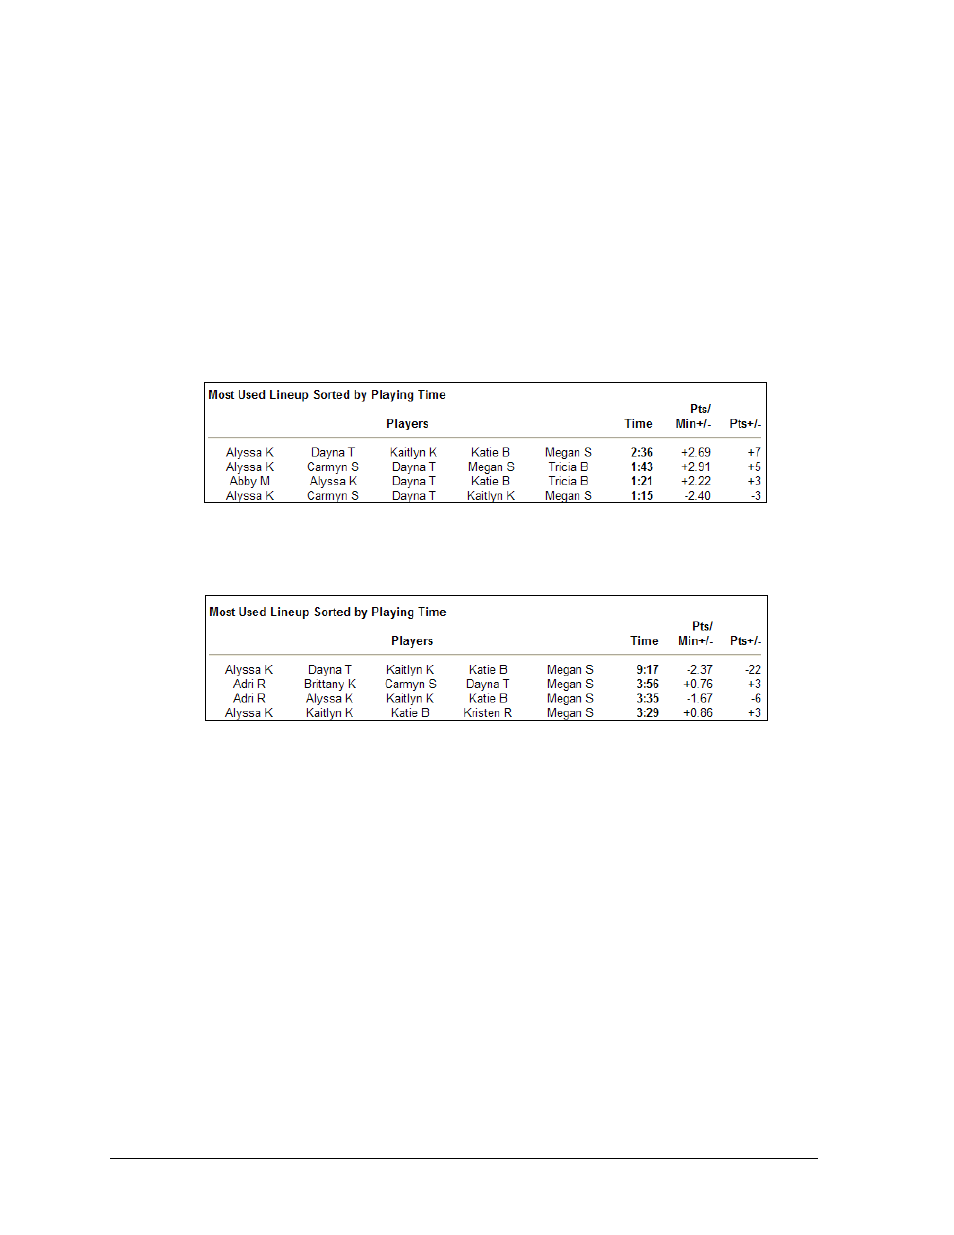
The example shown in Figure 81 was taken from a Most Used Lineup report of a team that
was Leading By 5 or fewer points. The top group of players had a net gain of 7 points,
increasing the lead. Notice this is the same group of players from Figure 80 that had one of
the worst overall scoring margins, yet they seem to perform better when the team is ahead.
Now watch what happens in Figure 82 with the same lineup report and the team Trailing By 5
points. The same group actually had a net loss of 22 points, pulling the team further behind.
Such a trend may indicate that this particular group does not perform as well under pressure,
or that the players lack morale or cooperation when the team is behind.
Additional Suggestions:
Use comparisons when looking at the best or most used players in different periods
or times during the game, at home or away games, or against certain teams.
Mix and match the options to find strengths or weaknesses in specific areas, and then
use the reports as a guide for setting goals and charting the team’s progress.
Print out a list of the statistically best players for making substitutions when
particular game situations arise (late in the game and trailing, late in the game and
ahead, etc.).
Create custom printouts of the best lineups to use against rival teams.
Figure 81: Most Used Lineup & Leading
Figure 82: Most Used Lineup & Trailing