Cpe connectivity summary report – H3C Technologies H3C Intelligent Management Center User Manual
Page 110
101
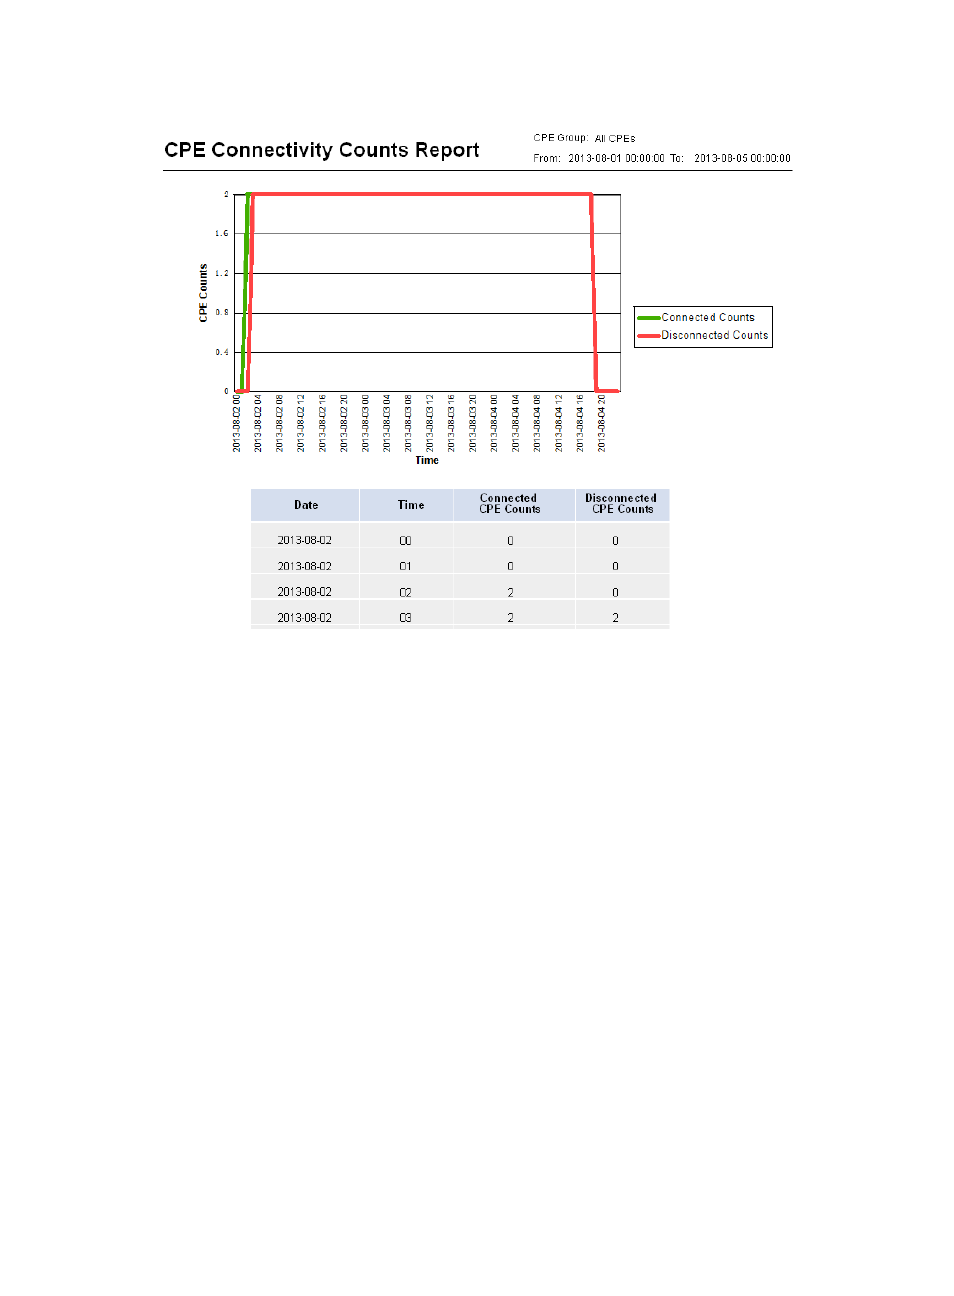
Figure 8 CPE Connectivity Count Report
CPE Connectivity Count Report parameters:
•
CPE Group—Statistics collection range, a CPE group or ALL CPEs.
•
From To—Statistics collection time range.
The CPE Counts trend graph displays the changes of CPE connections and disconnections in the specified
time range.
CPE Connectivity Count Report fields:
•
Date—Report date.
•
Time—Report time. The sampling time interval is one hour.
•
Connected CPE Counts—Total number of the CPEs connected to the ACS in the specified time
range.
•
Disconnected CPE Counts—Total number of the CPEs disconnected from the ACS in the specified
time range.
CPE Connectivity Summary Report
A CPE connectivity summary report collects CPE connectivity summary information of the specified CPEs
in the specified time range.
To view a CPE connectivity summary report, configure the following parameters:
•
Parameter "Begin Time" and "End Time"—Select a statistics collection time range from the list. You
can select a specific time range, such as Last Hour, Last Day, Last Week, or Last Month, or select
Custom Range, and then specify the start time and end time manually.