Cpe connectivity summary report – H3C Technologies H3C Intelligent Management Center User Manual
Page 115
106
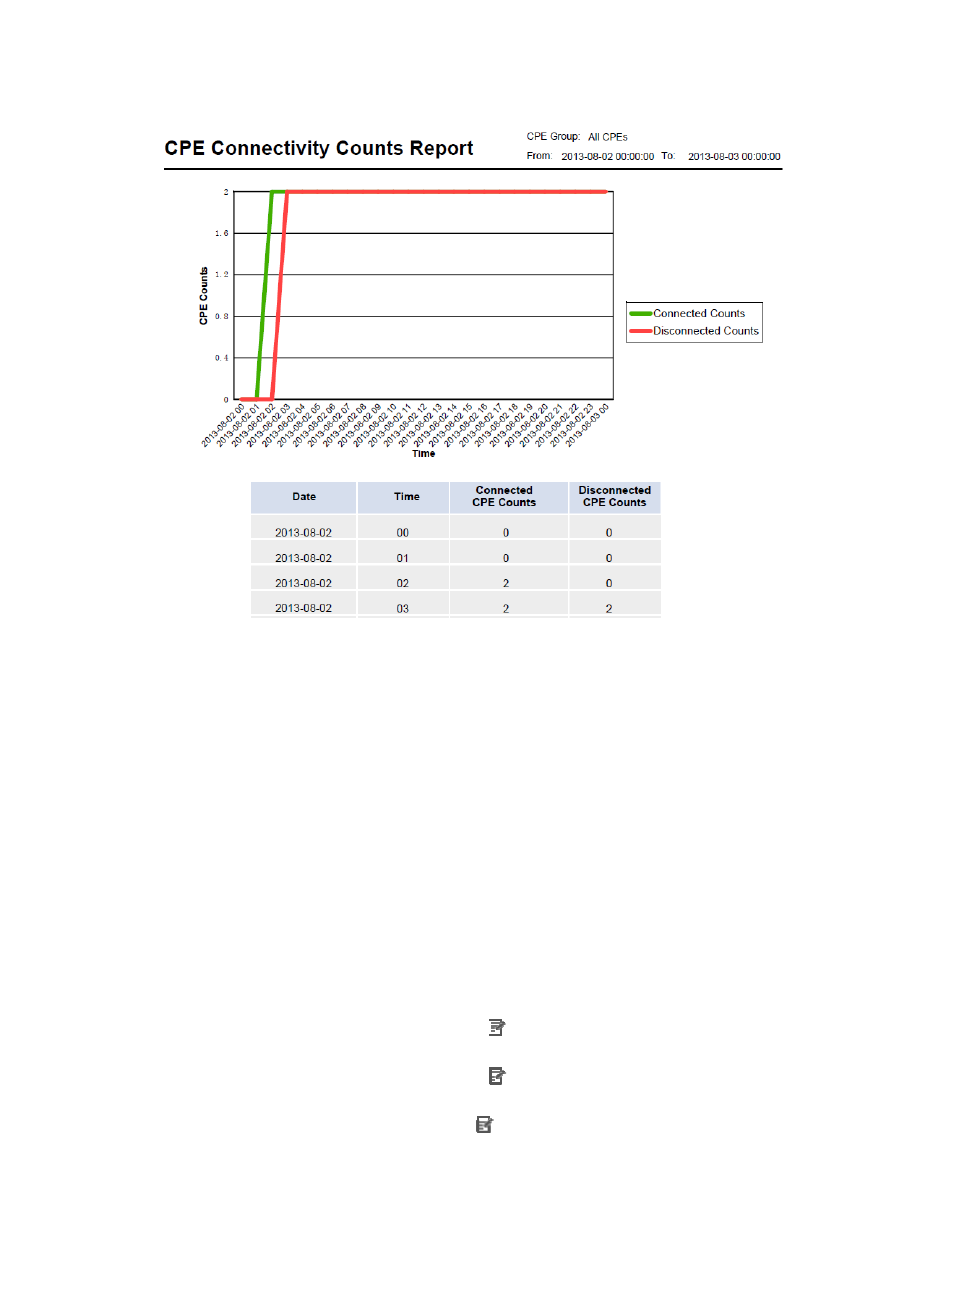
Figure 12 CPE Connectivity Count Report
CPE Connectivity Count Report parameters:
•
CPE Group—Statistics collection range, a CPE group or All CPEs.
•
From To—Statistics collection time range.
The CPE Counts trend graph displays the changes of CPE connections and disconnections in a schedule.
CPE Connectivity Count Report fields:
•
Date—Report date.
•
Time—Report time. The sampling time interval is one hour.
•
Connected CPE Counts—Total number of the CPEs connected to the ACS in a schedule.
•
Disconnected CPE Counts—Total number of the CPEs disconnected from the ACS in a schedule.
CPE Connectivity Summary Report
A CPE connectivity summary report displays the summary of CPE connections in a schedule.
To add a CPE connectivity summary report, configure the following parameters:
•
CPE Group—Click the Set Parameter icon . The Set Parameter page appears. Select a CPE
group or All CPEs for statistics collection, and then click OK.
•
Begin Time—Click the Set Parameter icon . The Set Parameter page appears. Select the report
start time, and then click OK.
•
End Time—Click the Set Parameter icon . The Set Parameter page appears. Select the report
end time, and then click OK.
shows a CPE connectivity summary report.