Xtramus DApps-TAP V1.3 User Manual
Page 40
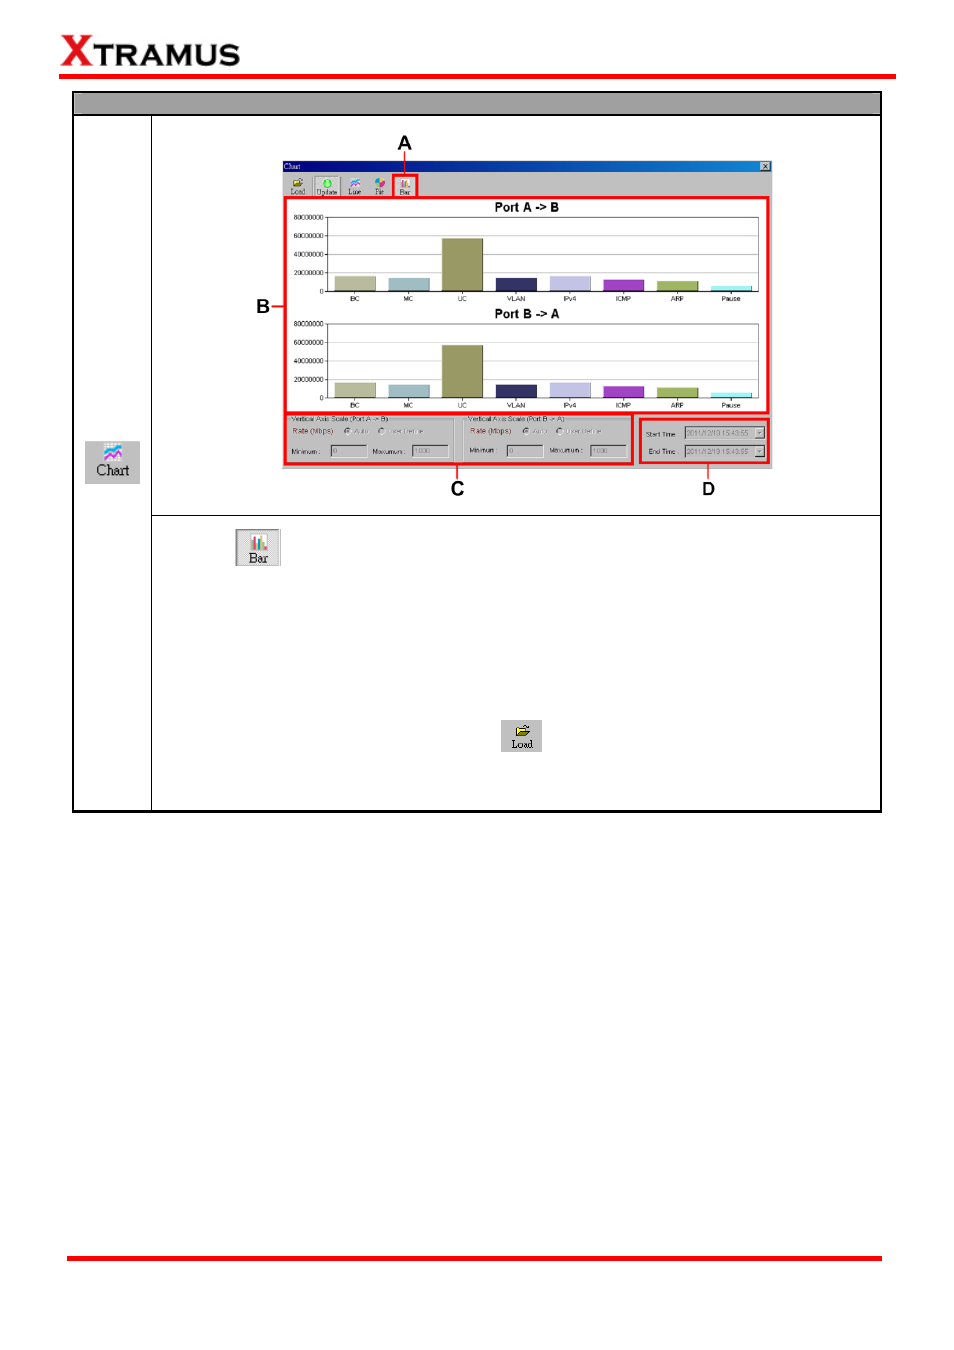
Chart_Bar
Click the
button as shown in A to view the bar chart in B field. The Bar chart shows
the rate of network event counts from Port A to Port B and Port B to Port A. Those includes:
BC (Layer 2 Broadcast), MC (Layer 2 Multicast), UC (Layer 2 Unicast), VLAN, IPv4, ICMP
(Ping), ARP, PAUSE.
You can set the Rate of packets to be analyzed in Mbps in C field. If you set in Auto mode,
the Rate will be set under a default setting, if you set in User Define mode, than a Minimum
and a Maximum rate range will be available to modify.
You can open a saved chart by clicking the
button. When opening a saved chart, the
Start/End Time scroll field from D will be available. The function of Start/End Time allows
you to check the status of the packets of the saved chart in different times.
40
E-mail: [email protected]
Website: www.Xtramus.com
XTRAMUS TECHNOLOGIES
®