Xtramus NuApps-2544-RM V1.3 User Manual
Page 48
48
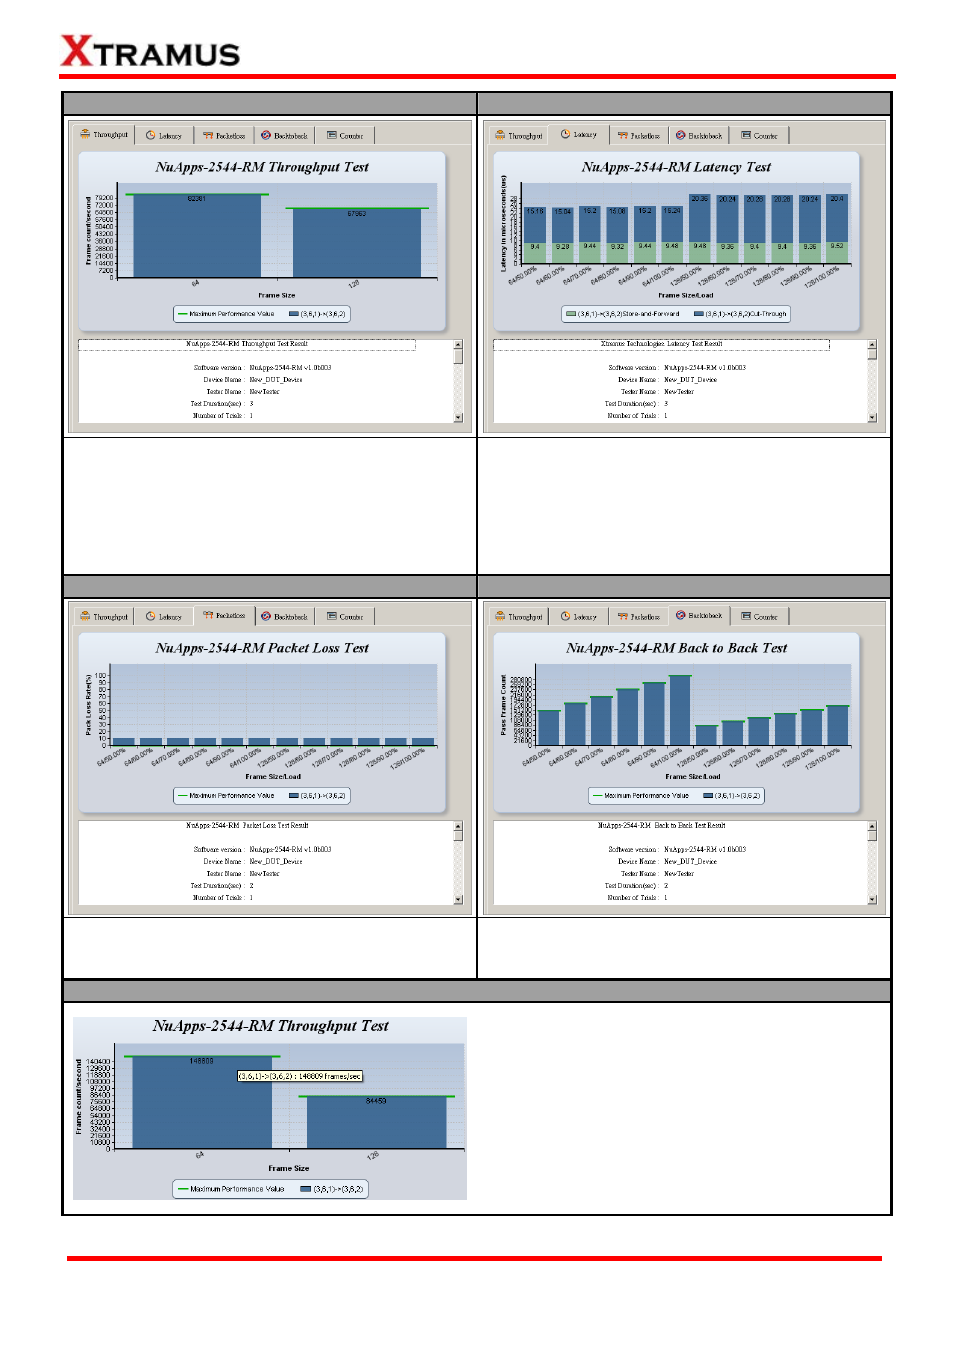
Throughput Test Result Chart
Latency Test Result Chart
This chart uses Frame Count per Second as
X-Axis, and Frame Size as Y-Axis to show DUT’s
throughput performance.
This chart uses Latency in Microseconds (µs) as
X-Axis, and Frame Size/Load as Y-Axis.
•
Store and Forward: Represents packets that were
stored inside DUT’s buffer before transmitted.
•
Cut Through: Represents packets that were
transmitted right away.
Packet Loss Test Result Chart
Back to Back Test Result Chart
This chart uses Packet Loss Rate (%) as X-Axis,
and Frame Size/Load as Y-Axis to show DUT’s
packet loss ratio.
This chart uses Pass Frame Count as X-Axis, and
Frame Size/Load as Y-Axis to show DUT’s back to
back test result.
Viewing Test Result Chart
To view detail statistics on the chart, please move
the mouse cursor to the part you would like to know
more, as shown in the figure on the left.
E-mail: [email protected]
Website: www.Xtramus.com
XTRAMUS TECHNOLOGIES
®