Online pro software – Casella CEL Nomad portable weather station User Manual
Page 32
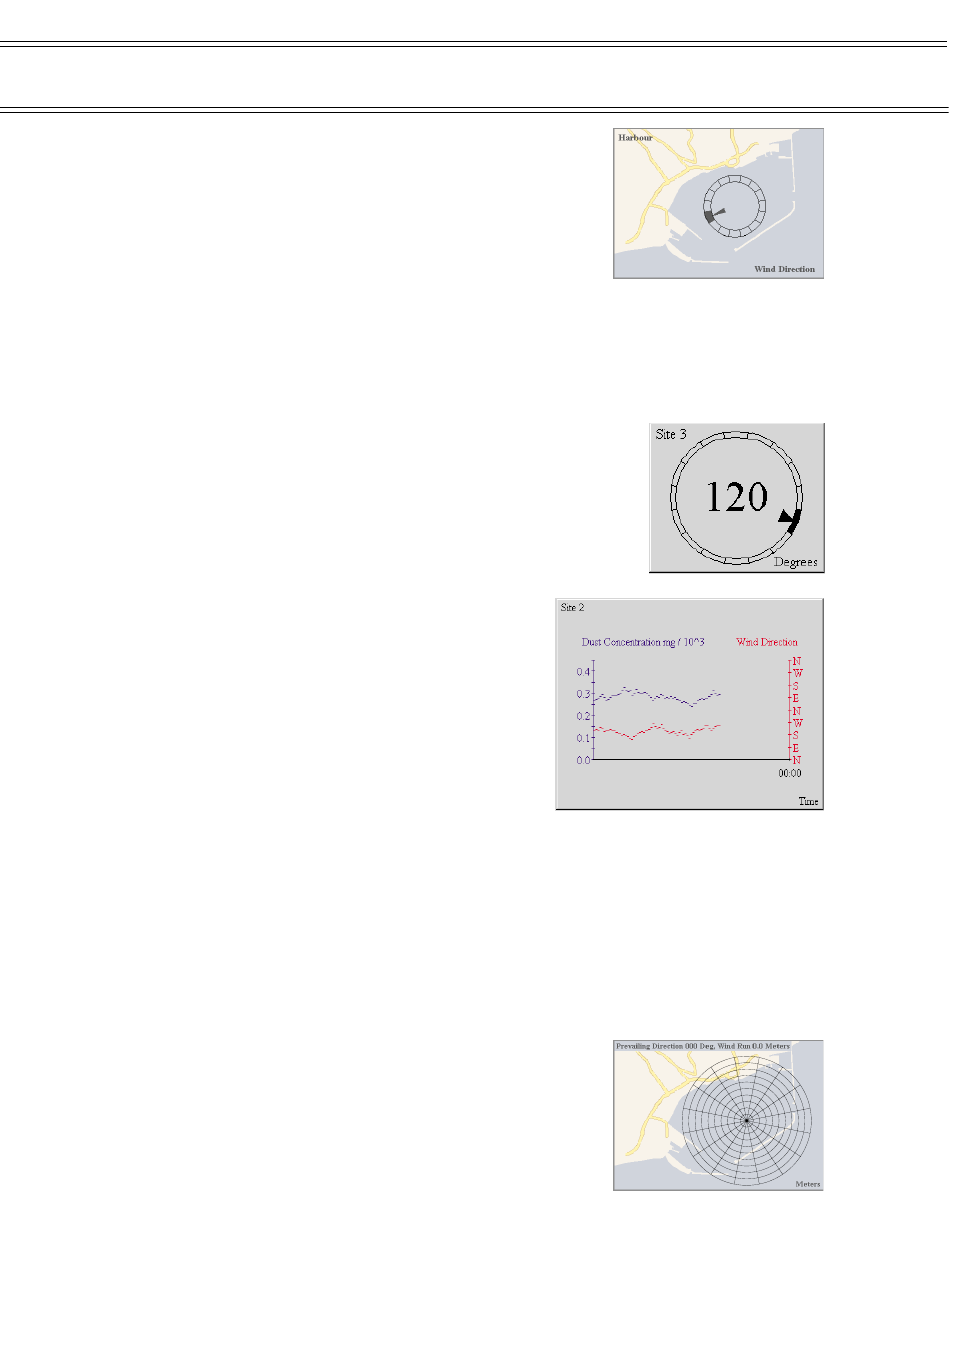
Usually the bitmap will be a map allowing the
wind direction to be compared with some physical
feature such as a harbour mouth or runway at an
airport. Initially the size of the item is set to that of the
bit map but it can be re-sized as required.
The wind direction options allow you to
specify the measuring station that is to be the source
of the wind direction data plus a data channel.
The position, size and colour of the rose on
the overlay are determined by options on the Overlay dialog. The width, length
and colour of the pointer can be specified in a similar way.
Each overlay can show only a single windrose. However, overlays can
be positioned together to indicate wind directions from several points around an
area, as shown in Figure 9.
Windrose
A windrose displays the wind direction both numerically
and graphically. The numerical representation will always
be three digits with leading zeros.
The wind direction options allow you to specify
the measuring station that is to be the source of the wind
direction data plus a data channel. The colour of the rose
and of the pointer can be specified via windrose options.
Graph
This displays a graph of one or two data values
against time.
If the data source is a wind direction,
then the axis can display directions (as opposed
to numeric values) and covers 720 degrees to
reduce the chance of discontinuities when the
direction passes through north (0
o
).
Data source 1 and 2 options allow you
to specify the measuring stations that are to be
the sources of the data plus relevant data
channels. Trace 1 and 2 options specify the axis title and line colour. The use of
autoranging or a manual setting with minimum and maximum range values can
also be specified.
Timebase options allow you to display the values taken during the
most recent period, defined in terms of hours, minutes and seconds (up to 23
hours, 59 minutes and 59 seconds). When the time base is less then 4 hours,
data is displayed at a 1 second resolution. When the time base is 4 or more
hours, it is displayed at a 1 minute resolution.
Initially the graph will display any relevant data that has been logged
by the program in the time period that it is being displayed.
Realtime Windrose
This provides information about the wind speed and
direction. The data can be overlaid on a bitmap image
(usually a map).
A windrose is drawn, divided into 16 direction
sectors filled in proportion to the distance (time x
speed) that the wind has blown from the specified
direction. In addition, the text displayed at the top left
of the item is automatically produced, and shows the prevailing wind direction
and the total wind run.
Online Pro Software
Page 32 of 68
NOMAD Portable Weather Station
Users Handbook