Online pro software – Casella CEL Nomad portable weather station User Manual
Page 33
The wind direction options allow you to specify the measuring station
that is to be the source of the wind direction data plus a data channel. Similarly,
wind speed options allow you to specify the measuring station
4
that is to be the
source of the wind speed data plus a data channel. The position, size, colour and
distance between the circles of the windrose are determined by options on the
Overlay dialog.
A units dialog offers three options. Read as, so you can tell the PC
which units the station is using to measure the data, and Display so you can
specify the units in which you want to display the wind run. Duration sets the
rolling duration used in the display and calculations so that all data displayed is
from this period. Initially, the realtime windrose will display any relevant data
that has been logged by the program in the time period that it is displaying.
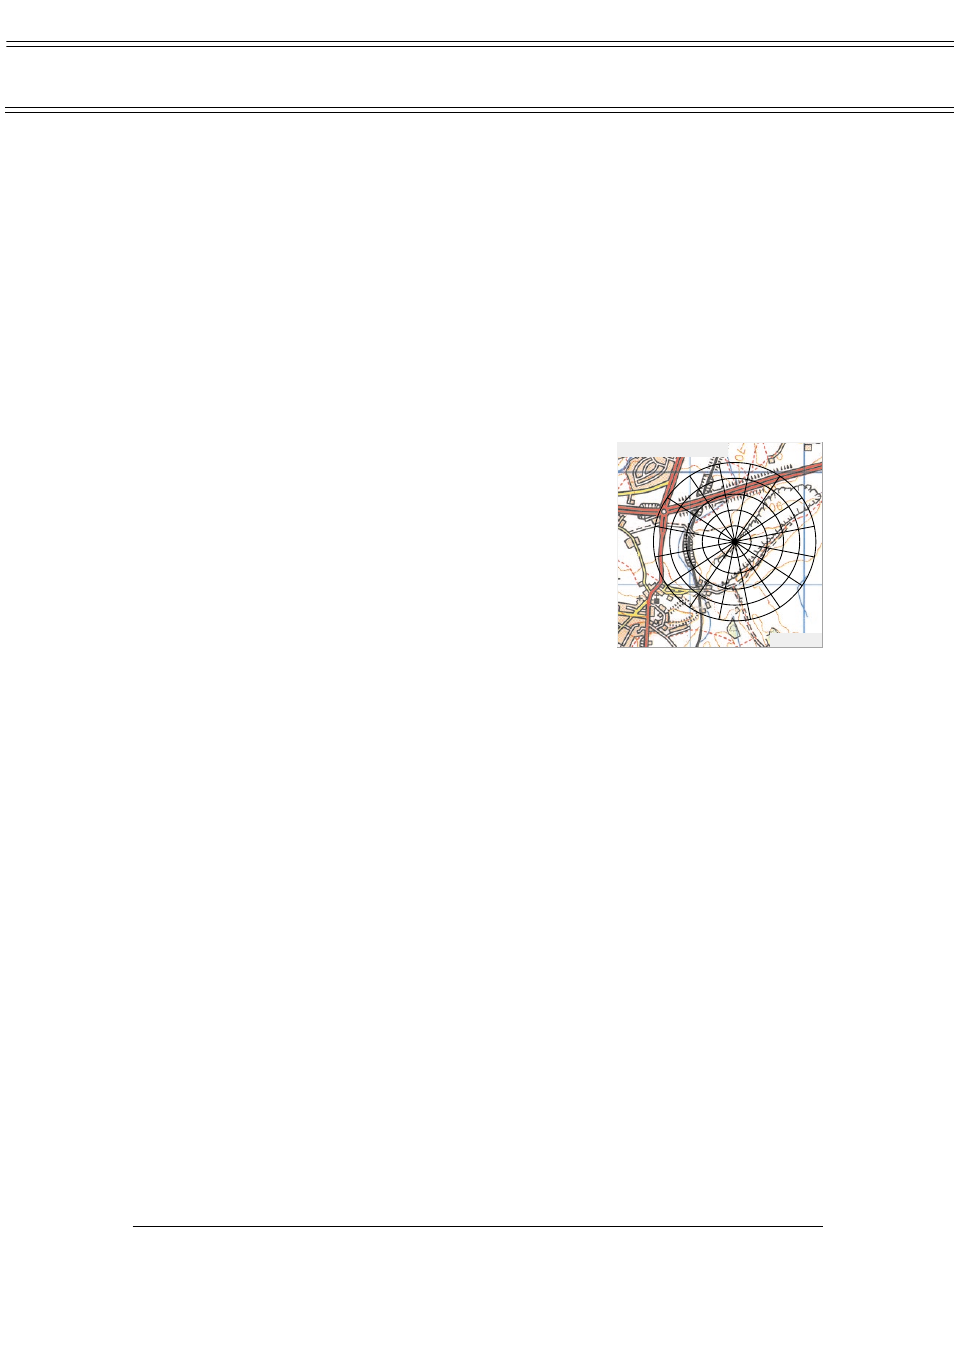
Each item can show only a single real time windrose. However,
windrose overlays can be positioned together to show wind directions from
several points around an area (see Figure 9).
Realtime Dustrose
This provides information about the dust concentrations
compared with wind direction. The data can be overlaid
on a bitmap image. A dustrose is drawn, divided into
16 direction sectors filled in proportion to the dust
concentration from the specified direction.
The wind direction options allow you to
specify the measuring station that is to be the source of
the wind direction data plus a data channel. Similarly,
dust concentration options allow you to specify the
measuring station
6
that is to be the source of the dust
concentration data and the channel to transmit it.
The position, size, colour and distance between the circles of the
windrose are determined by options on the Dustrose dialog. There is also a
duration option that sets the rolling duration used in the display and
calculations, so that all data displayed is from this period.
Initially, the real time dustrose will display any relevant data that has
been logged by the program in the time period that it is displaying. Each item
can show only a single real time windrose. However, windrose overlays can be
positioned together to show wind directions from several points around an area.
5.3.4
Saving the Display File
When all items required for the display page or pages have been added and
positioned, you can save the screen layout for re-use.
1.
Select the File menu and use the Save As... option.
2.
Enter a suitable filename and file path in the Save As dialog.
3.
Press Save to save your choice.
The screen layout, including all pages, will be saved, and can be
loaded for use at any time via the File menu and the Open... option.
If required, a screen layout can be loaded automatically and switched to run in
real-time mode when you start the Online Pro software as described in Section
5.2.5. The Save Screen Image... option on the File menu allows the, current
screen to be saved as a bitmap. In addition to general record keeping, this
feature is particularly useful for recording special events.
Online Pro Software
Dust Concentration
gm / m^3
Note 6:
Different stations can be selected, but will probably give meaningless results.
Page 33 of 68
NOMAD Portable Weather Station
Users Handbook