3 simulated events, Simulated events – CIRCUTOR MDC-20 User Manual
Page 47
MDC-20
User Manual
Page 47 of 58
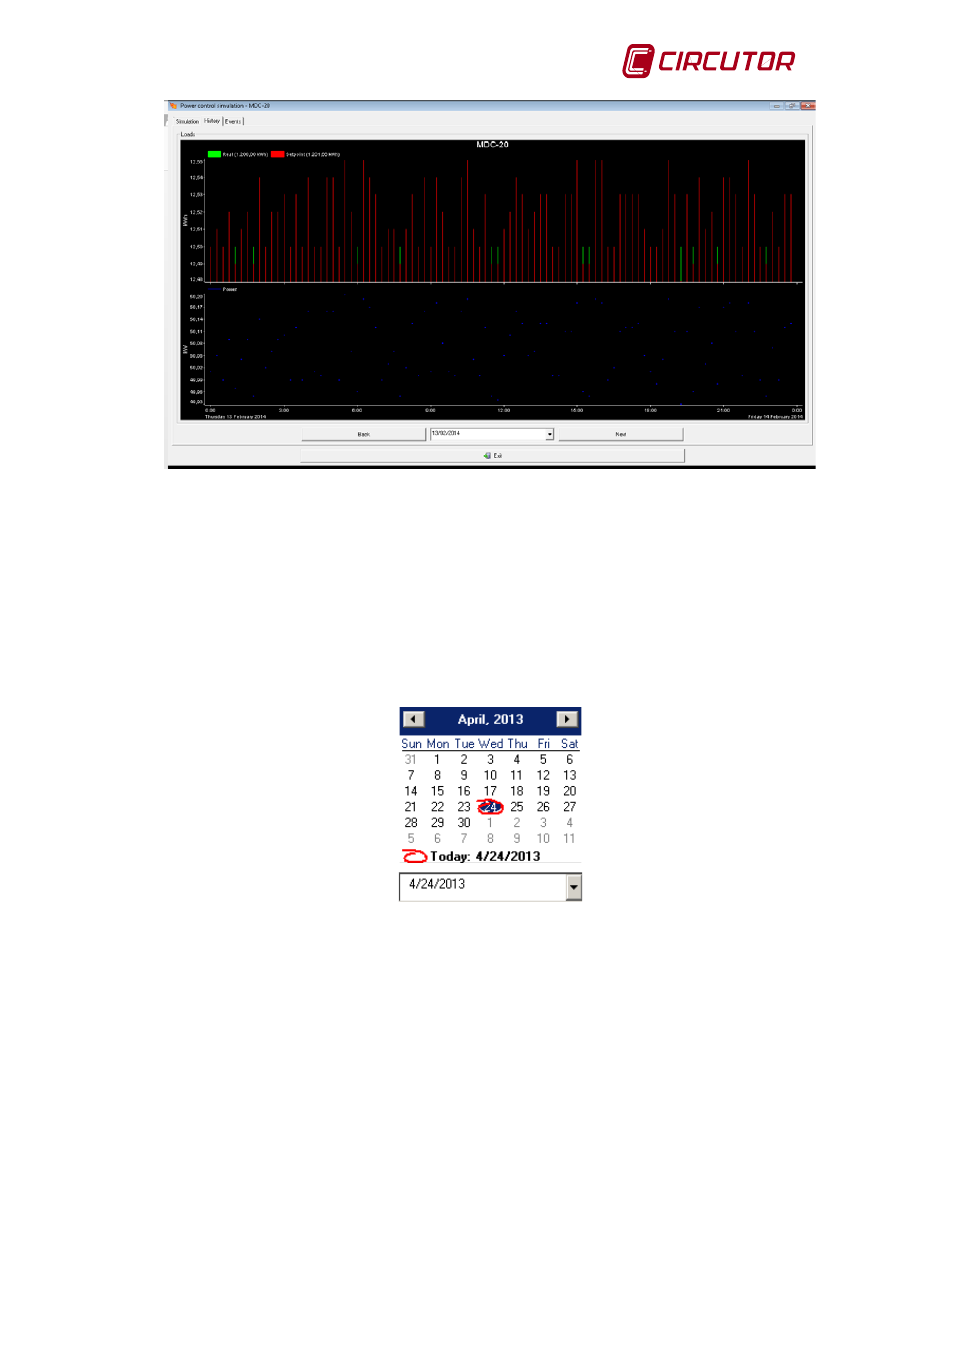
Fig.8-37 . – Simulated data log
When carrying out the simulation, the program creates a file where it saves the values being
simulated. This file saves the data each month. The graphics and events represented are data
which has been stored in that file.
The file start date and end date are displayed. The graphic shows the simulation consumption
(KWh), set point and average power of the simulation (KW med). Time is shown as a whole day
in the graphic.
To view a different interval to that shown, open the date menu and select the required date.
Fig.8-38 . – Date selection
8.2.3 Simulated events
The events option allows you to separately view the connection/disconnection of each of the
simulated installation loads. When pressing events the following screen is displayed.