CIRCUTOR MDC-20 User Manual
Page 48
MDC-20
Page 48 of 58
User Manual
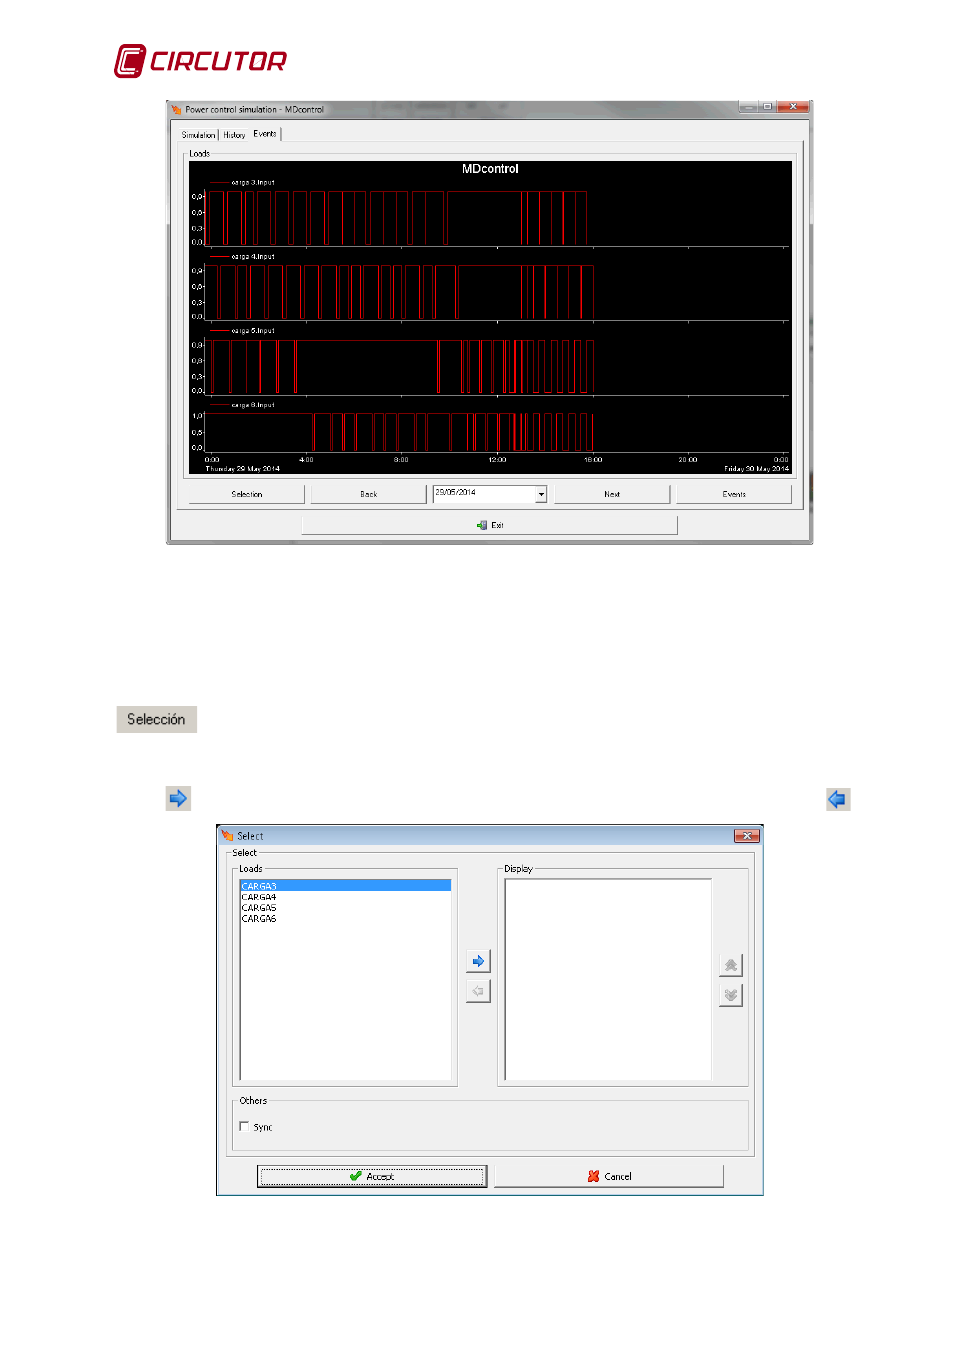
Fig.8-39 . – Display of events (simulated)
In the graphic, time is divided into two hour intervals. If you left-click the mouse on the graphic,
a cursor will appear where with the arrow buttons you can move along each point of the graphic
and view the time at that point.
There are various tabs in the Events screen that enable different options for representing
events. The options are as follows:
View the data selection screen to be represented in the graphic.
When pressing selection, the load group selection window that we want to view in the log
graphic is opened. The loads to be viewed must be moved to the table on the right with the
arrow
. To delete the load display, move the load to the left-hand column with the arrow
.
Fig.8-40 . – Selection of data for logs