The plot – Measurement Computing USB-5100 Series User Manual
Page 10
USB-5100 Series Software Help
Introducing USB-5100 Series
The Plot
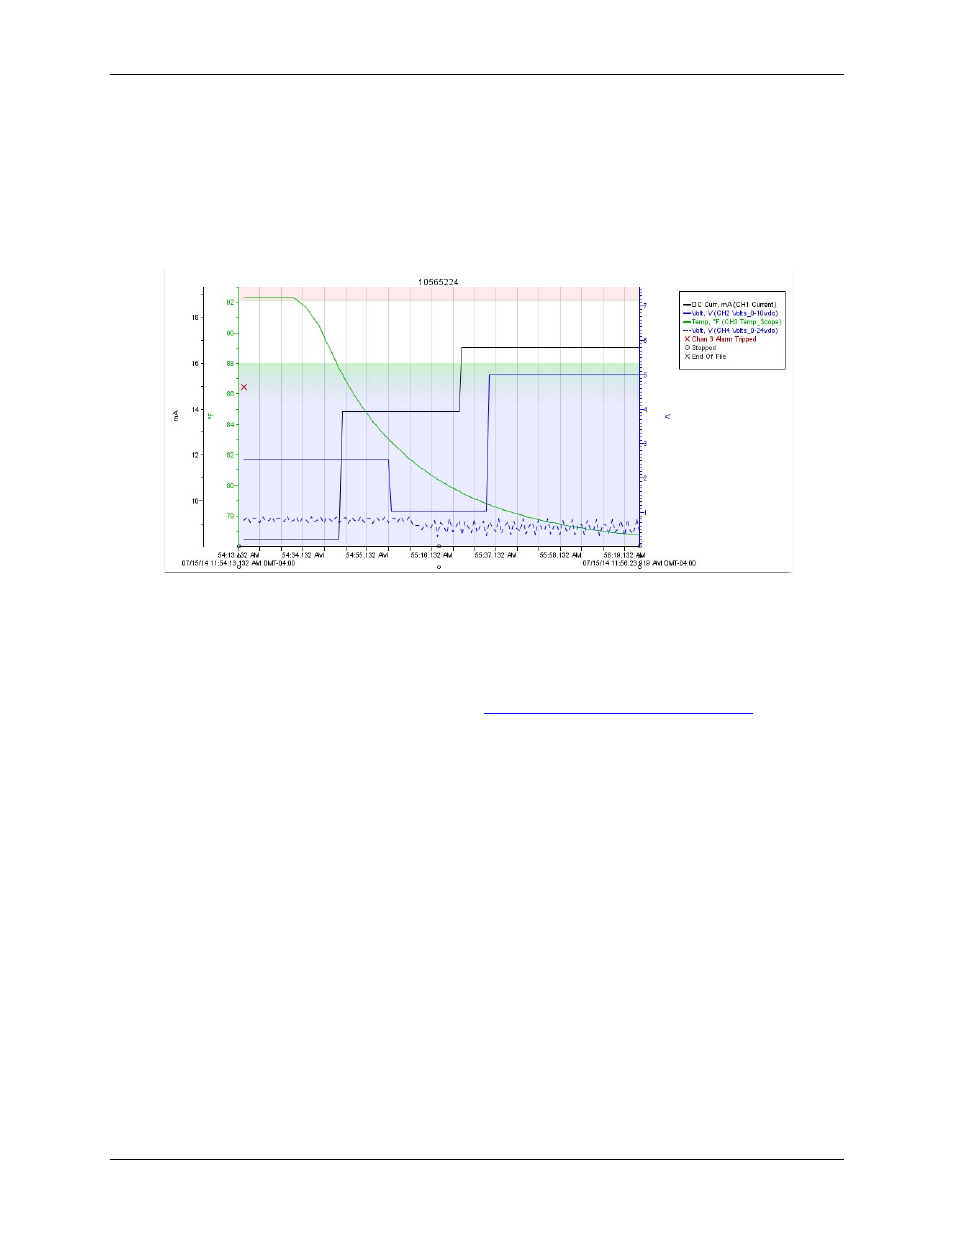
The plot displays the data series and events in a graph. The plot has a time axis (x-axis) and a value axis (y-axis)
for each series selected in the Plot Setup dialog box. The title is displayed at the top of the plot by default. The
title text comes from the Description field in the Plot Setup dialog box.
The legend lists the keys (line colors and marker types) for each series, and is displayed to the right of the plot
by default. If the crosshair tool is in use, it also lists the date, time and point values currently selected by the
crosshair.
Figure 4. Plot Display
To hide the title, clear the
View»Title
checkbox.
To hide the legend, clear the
View»Legend
checkbox.
Double-click a plot element (series, axis, title, or legend) to change its properties, or right-click the plot and
select the item from the context menu.
For more information about working with the plot, see
Reading Out, Plotting, and Analyzing Data
10