Plotting data – Measurement Computing USB-5100 Series User Manual
Page 28
USB-5100 Series Software Help
Reading Out, Plotting, and Analyzing Data
Plotting Data
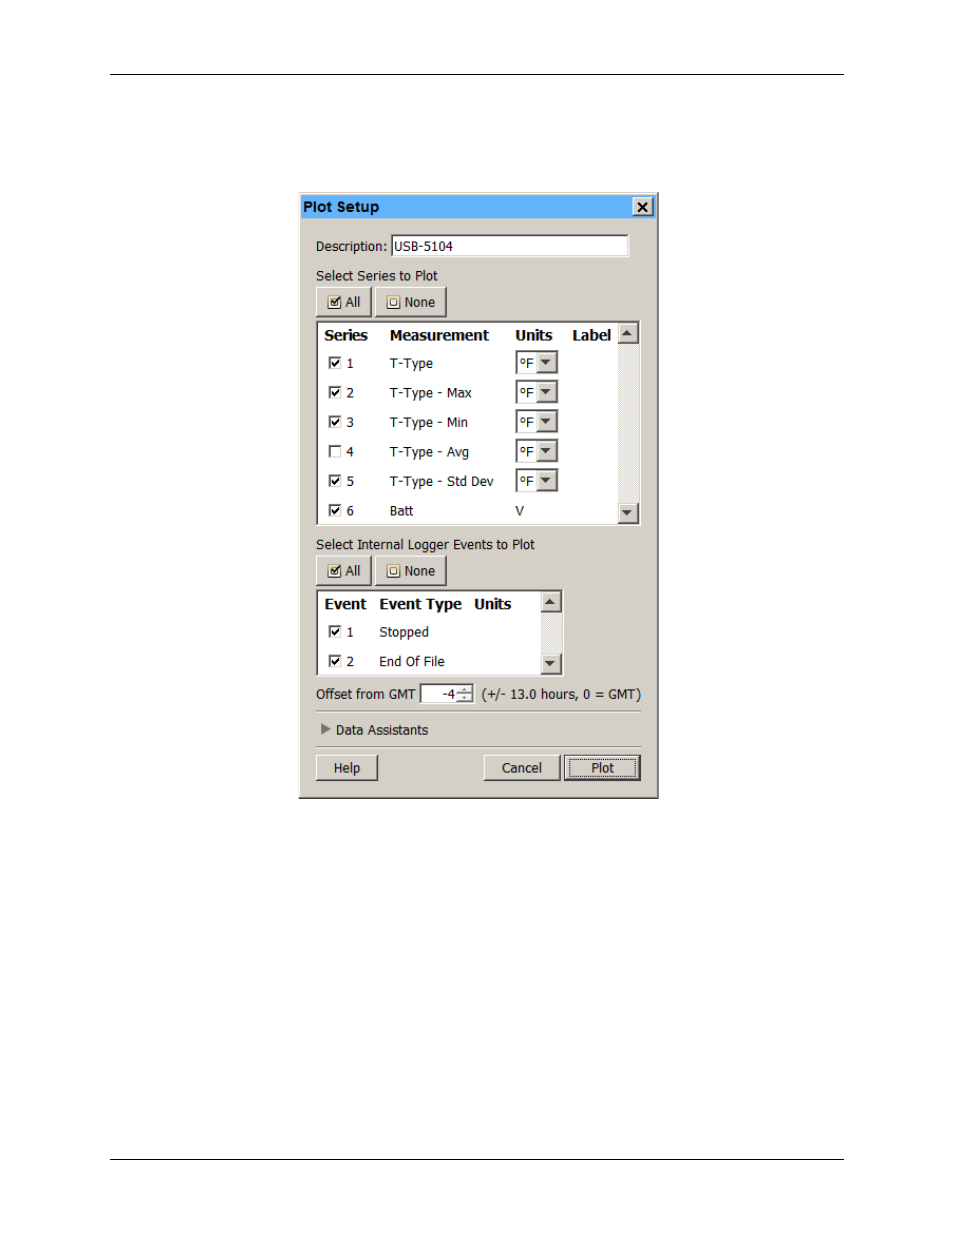
After you read out a logger or open a saved file, you can plot the data with the Plot Setup dialog box like the
following example.
Figure 13. Plot Setup Dialog Box
To plot the data, complete the following steps:
1. Use the existing description or type a new one. The default description matches the one used when
launching the logger and is used for the plot title.
2. Select the series to view on the plot. Click
All
or
None
to select or deselect all series, or click the
checkboxes to select or deselect individual series. Series types can include:
o
Logged data series, which is a series containing the sensor measurements, state changes, or statistics
recorded by the logger.
o
Derived series, which is a series calculated based on one or more logged data series. This could be a
filtered series if you configured filters in the Launch Logger dialog box.
o
Battery voltage, which lists the logger battery voltage recorded at each logging interval.
3. Change the default units for selected series if desired. You can also change the units for a series after it is
plotted.
4. Select the internal logger events to view on the plot. Click
All
or
None
to select or deselect all events, or
click the checkboxes to select or deselect individual events. Internal logger events are individually logged
occurrences that can be recorded at any time during deployment, regardless of the logging interval. These
28