Adding a graph label – Measurement Computing USB-5100 Series User Manual
Page 40
USB-5100 Series Software Help
Modifying a Plot
Adding a Graph Label
To add a graph label, complete the following steps:
1. Right-click the graph on a data point and select
Add Graph
Label
from the context menu to open the
Graph Label Properties
dialog box. Or, select
Edit»Add Graph Label
. To change an existing label,
double-click the label or select the label and click the Properties
icon on the toolbar.
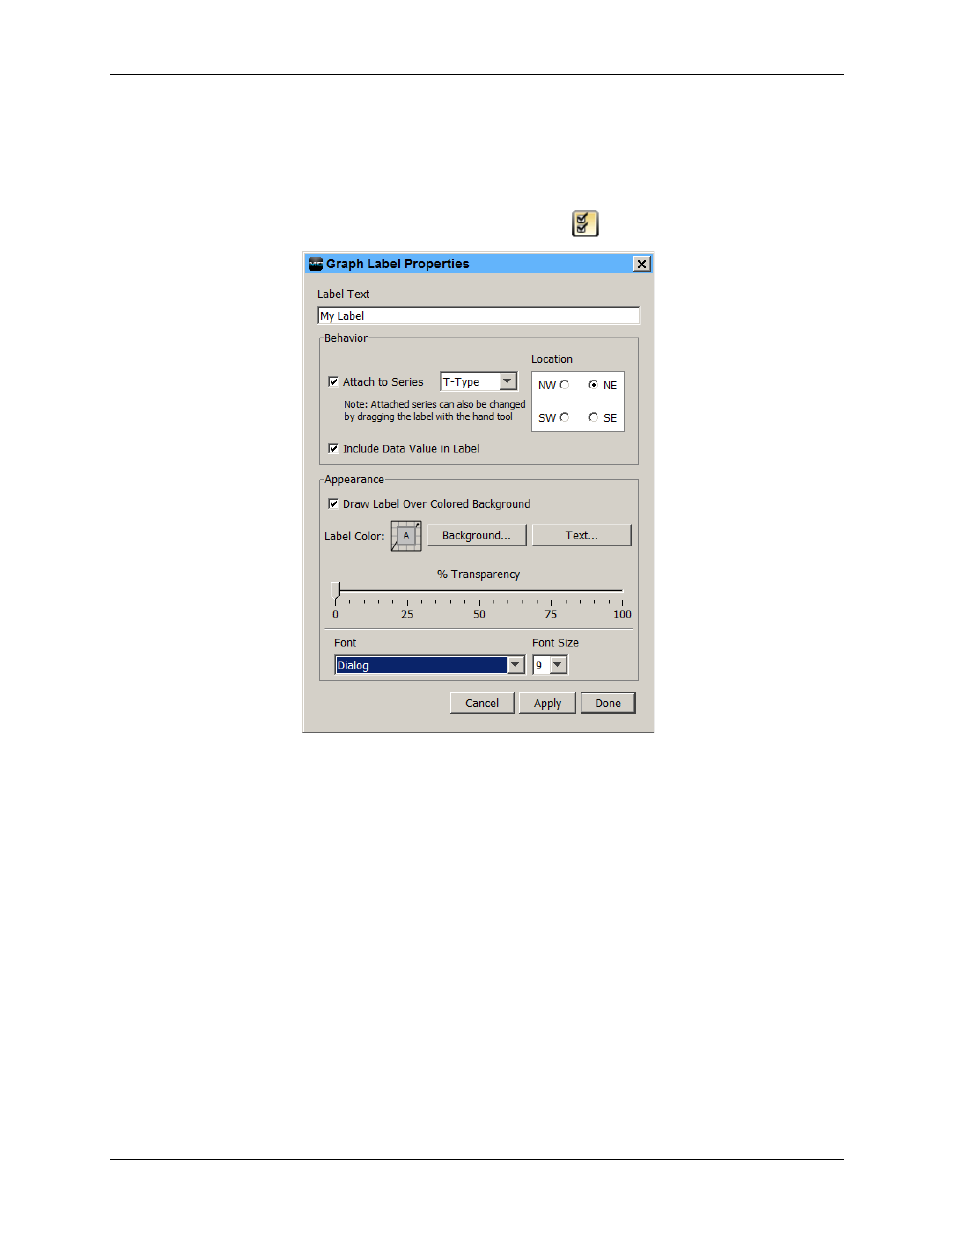
Figure 23. Graph Label Properties Dialog Box
2. Type up to a 24-character name for the label.
3. Select the
Attach to Series
checkbox to attach the label to a point on the series. Choose the name of the
series to attach it to from the drop-down list. Select the
Include Data Value in Label
checkbox to display
the value of the point in the label. Select the compass point to described the preferred location of the label
relative to the labeled point.
4.
Important:
This indicates the preferred location of the label (space permitting) with respect to the data
point it references. This is only available when the label is attached to a series.
5. Adjust the appearance of the label with these options:
o
Draw Label Over Colored Background:
Select this checkbox if you want the label to appear in a box
with a colored background.
o
Label Color Background:
If you chose to give the label a colored background, click this button to
select a background color.
o
Label Color Text:
Click this button to select a color for the label text.
o
% Transparency. Adjust the label's transparency, which refers to the ability to see the graph through
the label. At 0%, the label is opaque and you cannot see the graph through it. At 100%, the label is
invisible and only the graph can be seen.
o
Font:
Select a font for the label text.
o
Font Size:
Select a font size for the label text.
40